# Technical Data Extraction: Expert Load Heatmaps (Layers 19-24)
## 1. Document Overview
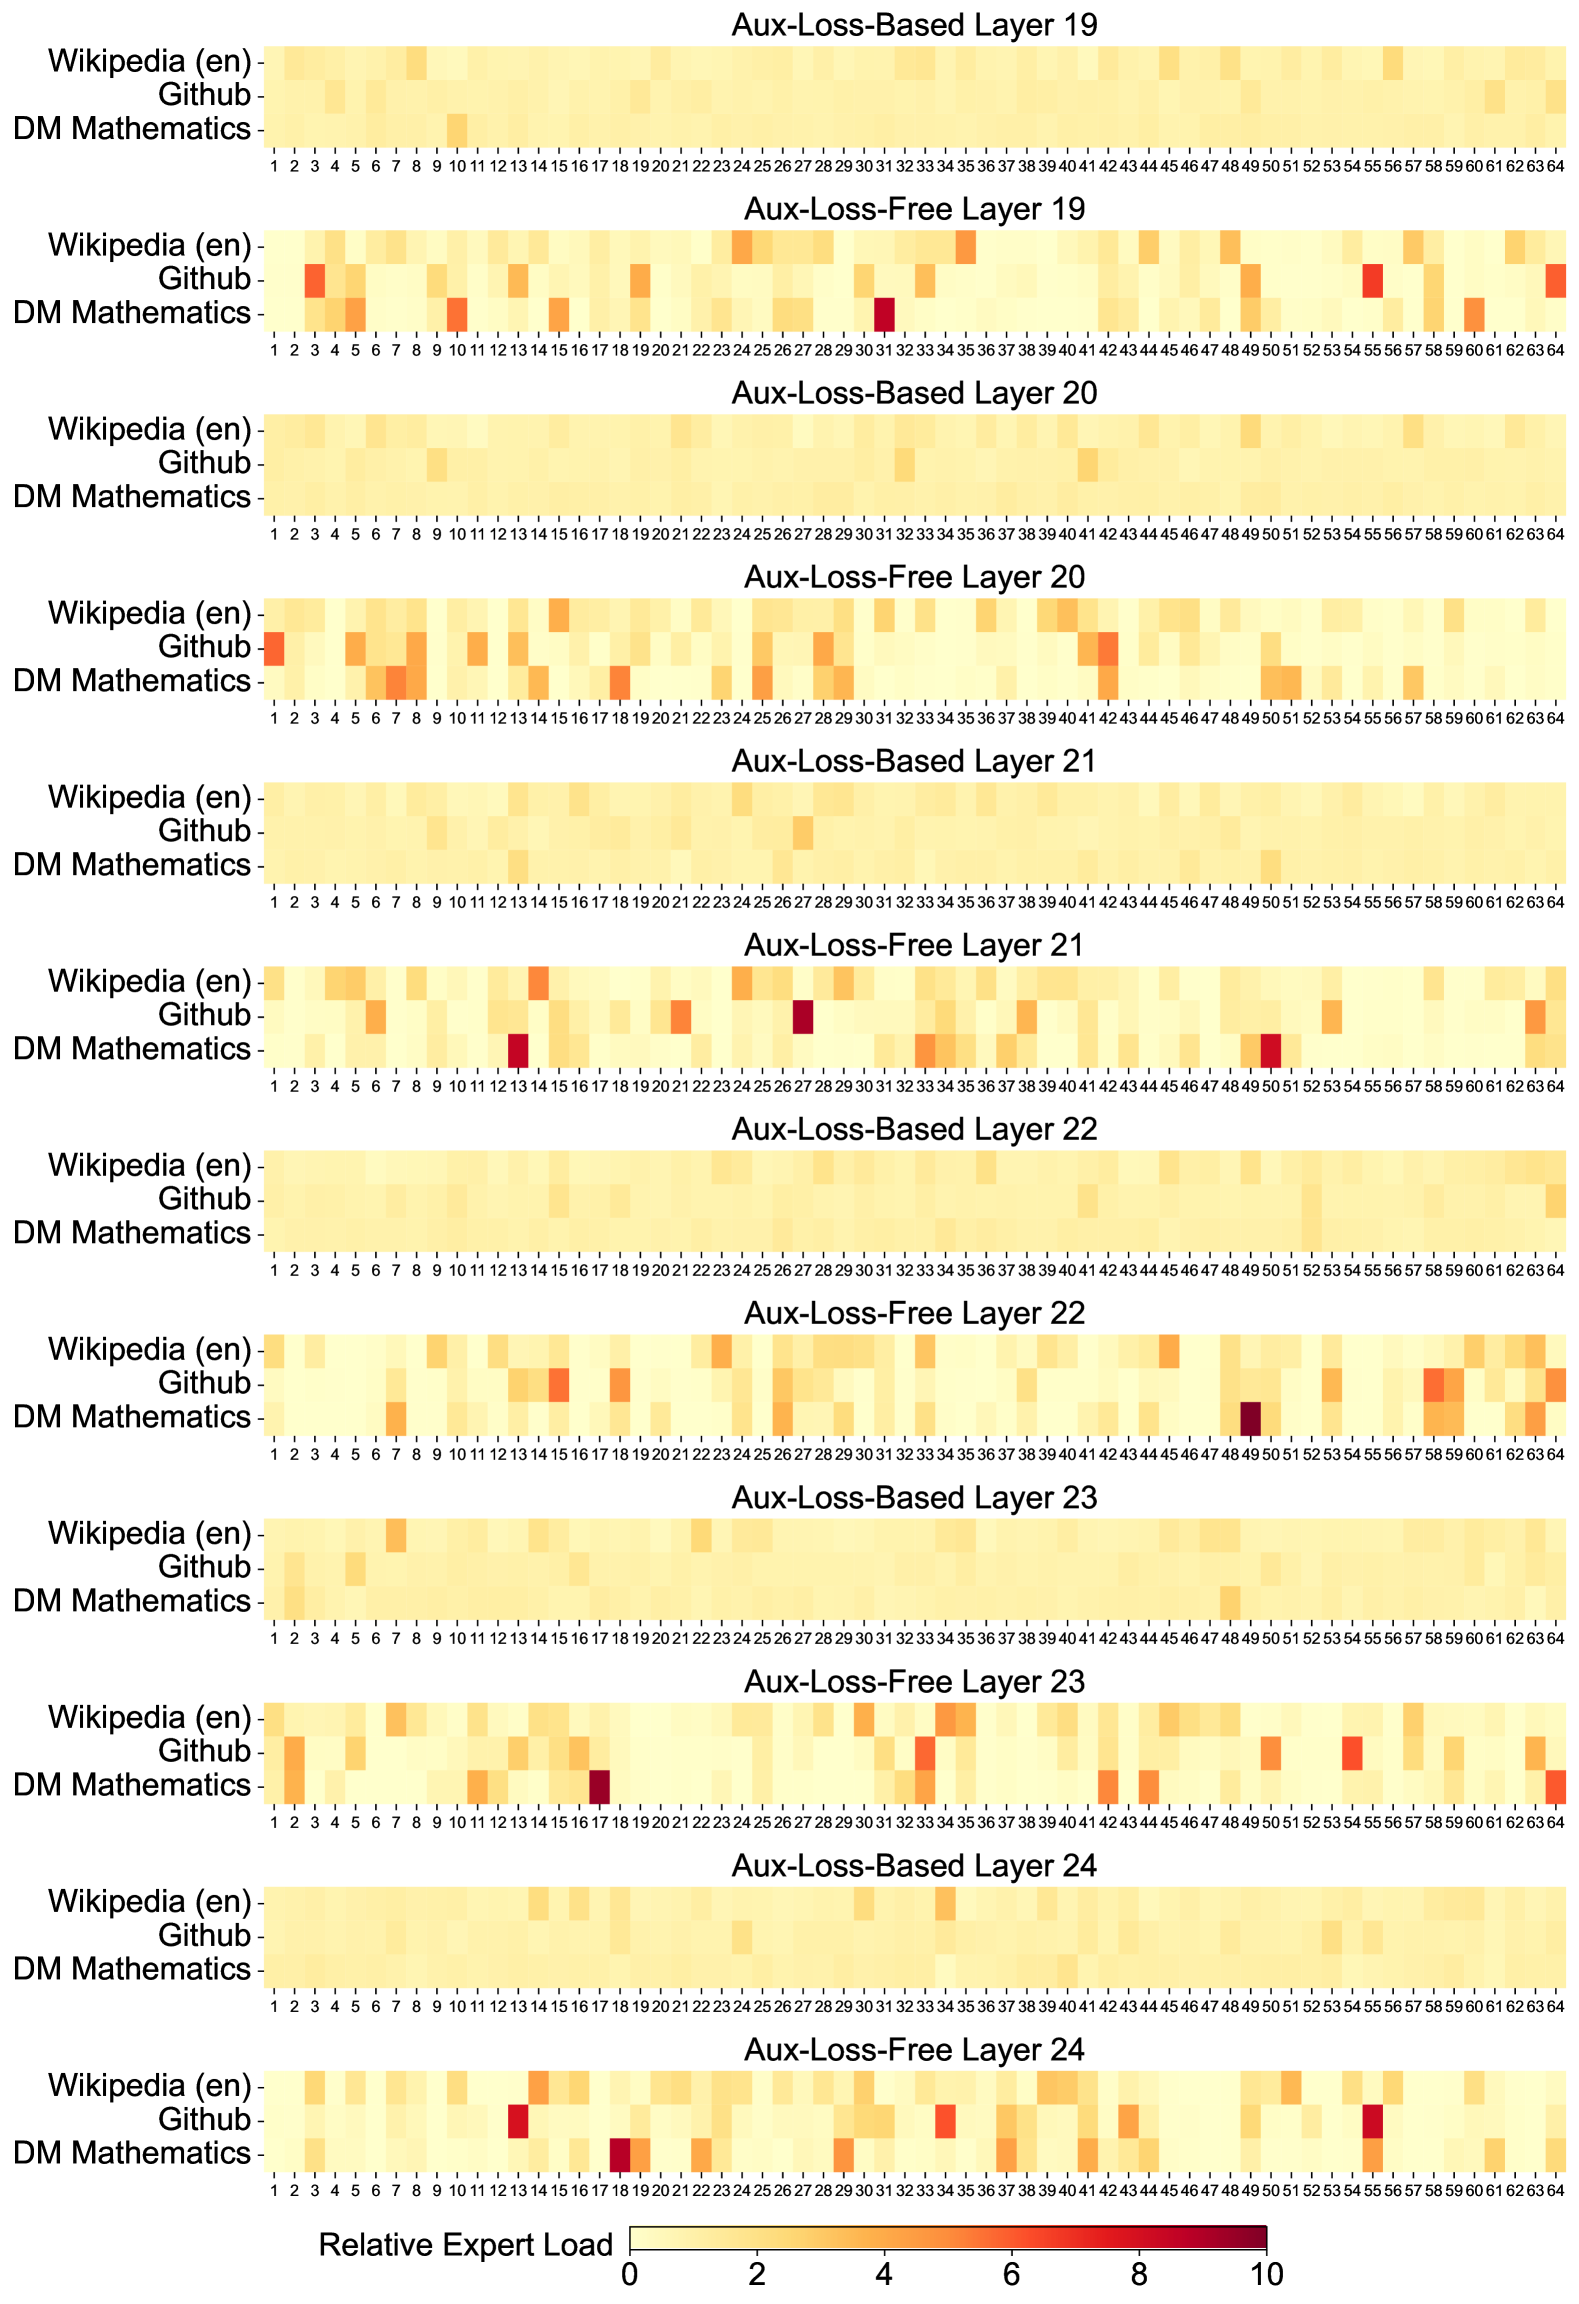
This image contains a series of 12 heatmaps organized in pairs, comparing "Aux-Loss-Based" and "Aux-Loss-Free" training methods across six neural network layers (Layers 19 through 24). The charts visualize the "Relative Expert Load" across 64 distinct experts for three different datasets.
## 2. Global Components and Metadata
* **Language:** English.
* **Primary Metric:** Relative Expert Load.
* **Scale (Legend):** Located at the bottom center. It is a continuous color gradient ranging from 0 (Pale Yellow) to 10 (Deep Red/Maroon).
* **Y-Axis Categories (Datasets):**
1. Wikipedia (en)
2. Github
3. DM Mathematics
* **X-Axis Categories (Experts):** Numbered 1 through 64 for every heatmap.
* **Layout Structure:** 6 vertical blocks (Layers 19, 20, 21, 22, 23, 24). Each block contains two heatmaps:
* Top: Aux-Loss-Based
* Bottom: Aux-Loss-Free
---
## 3. Detailed Heatmap Analysis by Layer
### Layer 19
* **Aux-Loss-Based:** Shows a very uniform distribution. Most experts are in the 0-2 range (pale yellow). No significant spikes are visible.
* **Aux-Loss-Free:** Shows significant specialization and load imbalance.
* **Github:** High load (orange/red) on experts 4, 56, and 64.
* **DM Mathematics:** High load (dark red) on expert 31; significant load on experts 4, 6, 10, 15, 49, and 61.
### Layer 20
* **Aux-Loss-Based:** Highly uniform. Almost all experts across all datasets are pale yellow (~1-2 load).
* **Aux-Loss-Free:**
* **Wikipedia (en):** Slight increase in load around experts 25-30.
* **Github:** High load on experts 1, 41, and 42.
* **DM Mathematics:** High load on experts 6, 8, 18, 29, and 50.
### Layer 21
* **Aux-Loss-Based:** Uniform distribution; no expert exceeds the light orange threshold.
* **Aux-Loss-Free:**
* **Wikipedia (en):** Spike at expert 15.
* **Github:** Significant spike (dark red) at expert 27.
* **DM Mathematics:** Significant spikes (dark red) at experts 13 and 50.
### Layer 22
* **Aux-Loss-Based:** Uniform distribution.
* **Aux-Loss-Free:**
* **Wikipedia (en):** Moderate load across experts 58-64.
* **Github:** Spikes at experts 15 and 59.
* **DM Mathematics:** Very high load (darkest red) at expert 49; moderate load at experts 7 and 59.
### Layer 23
* **Aux-Loss-Based:** Uniform distribution.
* **Aux-Loss-Free:**
* **Wikipedia (en):** Spike at expert 7.
* **Github:** Spikes at experts 1, 33, and 54.
* **DM Mathematics:** High load (dark red) at expert 17; moderate load at experts 43 and 63.
### Layer 24
* **Aux-Loss-Based:** Uniform distribution.
* **Aux-Loss-Free:**
* **Wikipedia (en):** Spike at expert 15.
* **Github:** High load (dark red) at expert 13; moderate load at experts 4, 43, and 55.
* **DM Mathematics:** High load (dark red) at experts 18 and 55.
---
## 4. Key Trends and Observations
### Trend 1: Aux-Loss Impact
* **Aux-Loss-Based:** In all layers (19-24), the "Aux-Loss-Based" heatmaps appear visually "flat" and pale. This indicates that the auxiliary loss function is successfully enforcing a balanced load across all 64 experts, preventing any single expert from being over-utilized.
* **Aux-Loss-Free:** In all layers, the "Aux-Loss-Free" heatmaps show high contrast with specific "hot spots" (dark red cells). This indicates that without the auxiliary loss, the model naturally gravitates toward specific experts for specific datasets, leading to high expert specialization and load imbalance.
### Trend 2: Dataset Specialization (Aux-Loss-Free)
* **DM Mathematics** consistently shows the most extreme "hot spots" (values approaching 10 on the scale), suggesting mathematical tasks utilize highly specific neural pathways compared to general text (Wikipedia).
* **Github** also shows distinct specialization, often on different experts than DM Mathematics, indicating the model differentiates between code and mathematical logic.
### Trend 3: Expert Sparsity
* In the "Aux-Loss-Free" versions, many experts (columns) remain pale yellow across all three datasets, suggesting they are under-utilized or "dead" experts, while a small subset handles the majority of the relative load.