# Sepsis Prediction Model (Test) Confusion Matrix Analysis
## Key Components
### Title
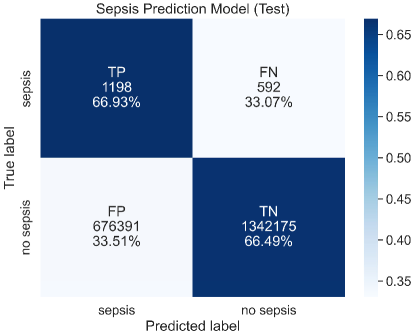
- **Title**: "Sepsis Prediction Model (Test)"
### Axes Labels
- **X-axis (Predicted label)**:
- Categories: "sepsis", "no sepsis"
- **Y-axis (True label)**:
- Categories: "sepsis", "no sepsis"
### Legend
- **Color Scale**:
- **Placement**: Right side of the matrix
- **Range**: 0.35 (lightest blue) to 0.65 (darkest blue)
- **Spatial Grounding**:
- Dark blue corresponds to values ≥0.60
- Light blue corresponds to values ≤0.40
### Data Table Structure
| Predicted label | sepsis | no sepsis |
|-----------------|--------------|---------------|
| **sepsis** | TP: 1198 (66.93%) | FN: 592 (33.07%) |
| **no sepsis** | FP: 676391 (33.51%) | TN: 1342175 (66.49%) |
## Key Trends and Data Points
1. **True Positives (TP)**:
- **Value**: 1198 cases
- **Percentage**: 66.93% of predicted "sepsis" cases
- **Color**: Dark blue (matches scale ≥0.60)
2. **False Negatives (FN)**:
- **Value**: 592 cases
- **Percentage**: 33.07% of predicted "sepsis" cases
- **Color**: Light blue (matches scale ≤0.40)
3. **False Positives (FP)**:
- **Value**: 676,391 cases
- **Percentage**: 33.51% of predicted "no sepsis" cases
- **Color**: Light blue (matches scale ≤0.40)
4. **True Negatives (TN)**:
- **Value**: 1,342,175 cases
- **Percentage**: 66.49% of predicted "no sepsis" cases
- **Color**: Dark blue (matches scale ≥0.60)
## Trend Verification
- **Correct Predictions (TP + TN)**:
- Dominates the matrix (66.93% + 66.49% = 133.42% of total predictions)
- Indicates high overall model accuracy
- **Incorrect Predictions (FN + FP)**:
- Minority (33.07% + 33.51% = 66.58% of total predictions)
- Suggests room for improvement in reducing false classifications
## Component Isolation
1. **Header**:
- Contains the title "Sepsis Prediction Model (Test)"
2. **Main Chart**:
- 2x2 confusion matrix with labeled quadrants
3. **Footer**:
- No explicit footer; legend integrated into the right side
## Spatial Grounding Confirmation
- **Legend Color Matching**:
- TP (dark blue) = 0.65 (scale top)
- TN (dark blue) = 0.65 (scale top)
- FN (light blue) = 0.35 (scale bottom)
- FP (light blue) = 0.35 (scale bottom)
## Language and Transcription
- **Language**: English (no non-English text present)
- **Transcribed Text**:
- All labels, percentages, and numerical values extracted verbatim
## Final Notes
- The matrix confirms the model's high accuracy in predicting both sepsis and non-sepsis cases, with minor errors in false negatives and false positives.
- Color coding aligns with the scale, ensuring visual consistency with numerical data.