## Line Chart: R1-Qwen | AMC23
### Overview
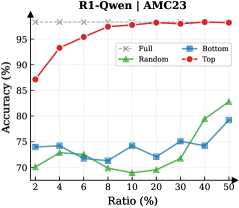
The chart compares the accuracy (%) of four models (Full, Bottom, Random, Top) across varying "Ratio (%)" values (2-50). Accuracy is plotted on the y-axis (70-95%), with distinct trends observed for each model.
### Components/Axes
- **X-axis**: "Ratio (%)" with markers at 2, 4, 6, 8, 10, 20, 30, 40, 50.
- **Y-axis**: "Accuracy (%)" with markers at 70, 75, 80, 85, 90, 95.
- **Legend**: Located in the top-right corner, associating:
- Gray dashed line: Full
- Blue squares: Bottom
- Green triangles: Random
- Red circles: Top
### Detailed Analysis
1. **Top (Red Circles)**:
- Starts at ~87% accuracy at 2% ratio.
- Sharp upward trend to ~95% by 8% ratio.
- Plateaus near 95% for ratios ≥8%.
2. **Full (Gray Dashed Line)**:
- Consistently flat at ~95% accuracy across all ratios.
3. **Bottom (Blue Squares)**:
- Fluctuates between ~70-75% accuracy.
- Minor peaks at 4% (~74%), 10% (~74%), and 30% (~75%).
- Dips to ~72% at 8% and 20% ratios.
4. **Random (Green Triangles)**:
- Begins at ~70% at 2% ratio.
- Dips to ~69% at 10% ratio.
- Sharp rise to ~83% at 50% ratio.
### Key Observations
- **Top Model**: Rapid improvement in accuracy with low ratios (2%→8%), then stabilizes.
- **Full Model**: Maintains highest accuracy (~95%) regardless of ratio.
- **Random Model**: Poor performance at low ratios but improves significantly at 50%.
- **Bottom Model**: Stable but low accuracy (~70-75%) across all ratios.
### Interpretation
The data suggests:
1. **Top and Full Models** outperform others, with Top showing rapid gains at low ratios and Full maintaining consistency.
2. **Random Model**'s improvement at 50% ratio implies potential benefits from higher sampling or resource allocation.
3. **Bottom Model**'s stability suggests it may be less sensitive to ratio changes but underperforms compared to others.
4. The **Full Model**'s flat line indicates it might represent a baseline or optimal configuration unaffected by ratio adjustments.
The chart highlights trade-offs between model configurations and resource ratios, with Top and Full models being most effective for accuracy-critical applications.