## Chart: Competition Level Accuracy
### Overview
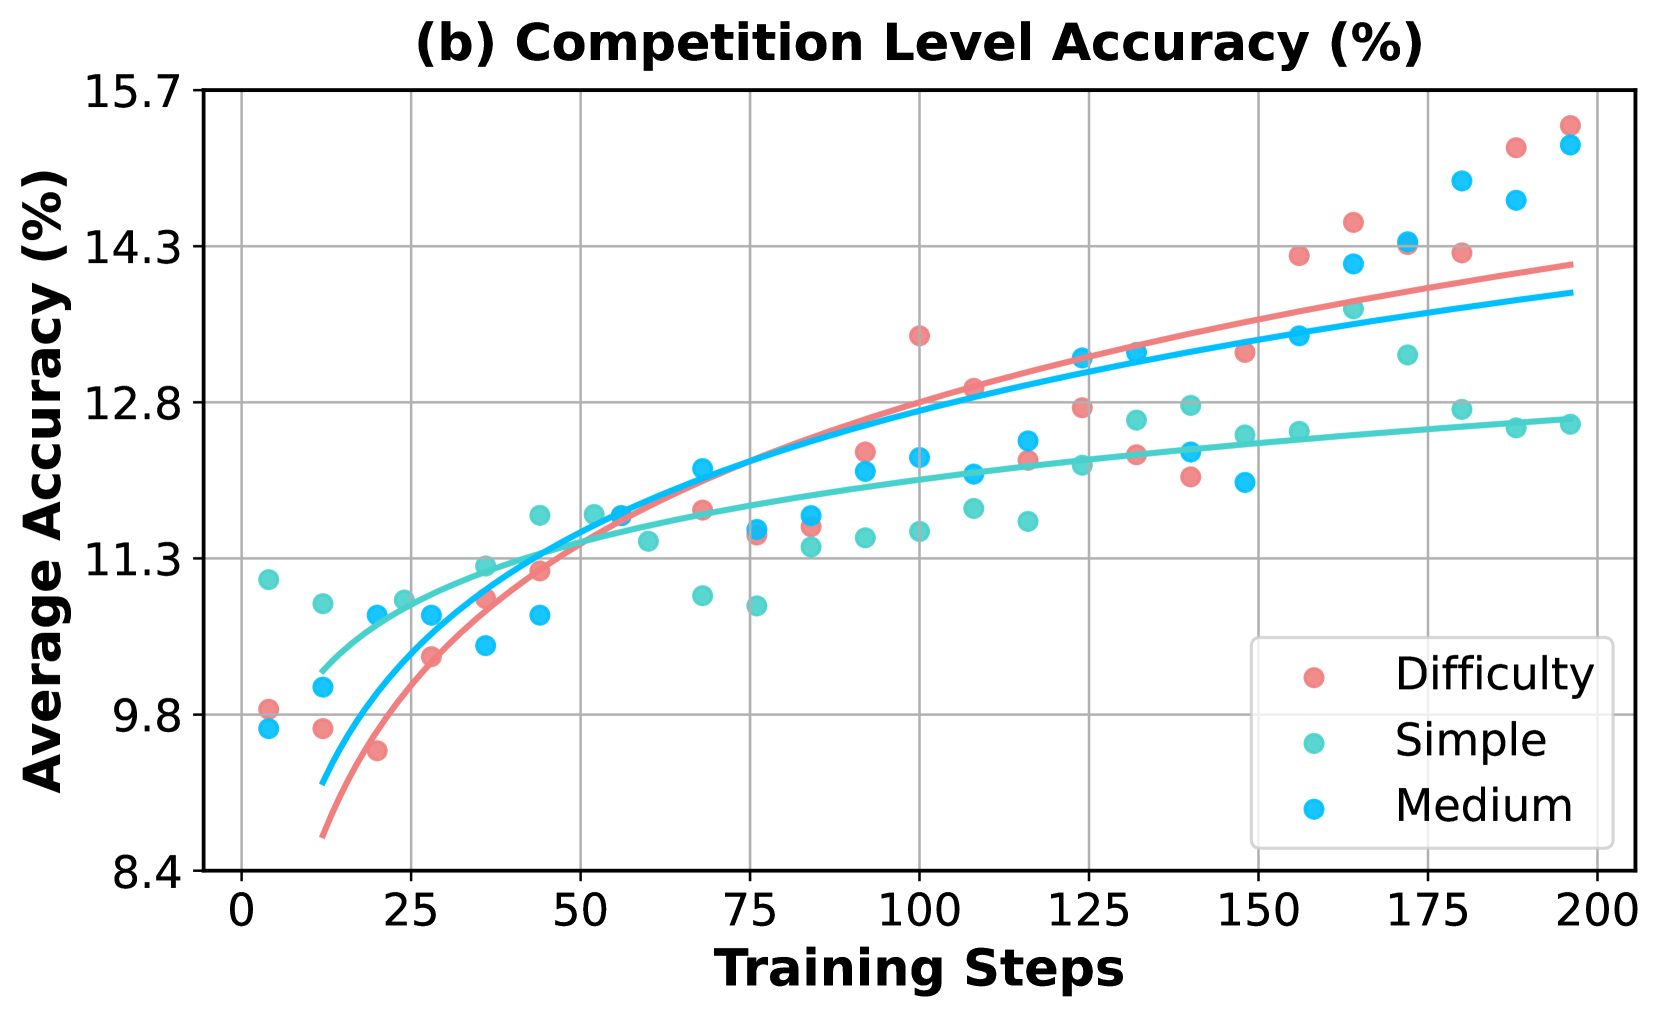
The image is a scatter plot showing the average accuracy (%) versus training steps for three different competition levels: Difficulty, Simple, and Medium. Each level is represented by a different color, and a trend line is fitted to each set of data points. The x-axis represents training steps, ranging from 0 to 200. The y-axis represents average accuracy (%), ranging from 8.4 to 15.7.
### Components/Axes
* **Title:** (b) Competition Level Accuracy (%)
* **X-axis:** Training Steps, with markers at 0, 25, 50, 75, 100, 125, 150, 175, and 200.
* **Y-axis:** Average Accuracy (%), with markers at 8.4, 9.8, 11.3, 12.8, 14.3, and 15.7.
* **Legend:** Located in the bottom-right corner, it identifies the colors corresponding to each competition level:
* Difficulty: Reddish-pink
* Simple: Light green/cyan
* Medium: Light blue
### Detailed Analysis
* **Difficulty (Reddish-pink):** The data points show an upward trend. The trend line starts at approximately 8.5% accuracy at 0 training steps and increases to approximately 13.5% accuracy at 200 training steps.
* At 25 training steps, accuracy is approximately 9.0%.
* At 50 training steps, accuracy is approximately 10.5%.
* At 100 training steps, accuracy is approximately 12.0%.
* At 150 training steps, accuracy is approximately 13.0%.
* At 200 training steps, accuracy is approximately 14.5%.
* **Simple (Light green/cyan):** The data points show a slight upward trend. The trend line starts at approximately 10.5% accuracy at 0 training steps and increases to approximately 12.5% accuracy at 200 training steps.
* At 25 training steps, accuracy is approximately 10.7%.
* At 50 training steps, accuracy is approximately 11.3%.
* At 100 training steps, accuracy is approximately 11.8%.
* At 150 training steps, accuracy is approximately 12.2%.
* At 200 training steps, accuracy is approximately 12.7%.
* **Medium (Light blue):** The data points show an upward trend. The trend line starts at approximately 9.8% accuracy at 0 training steps and increases to approximately 13.3% accuracy at 200 training steps.
* At 25 training steps, accuracy is approximately 10.3%.
* At 50 training steps, accuracy is approximately 11.3%.
* At 100 training steps, accuracy is approximately 12.0%.
* At 150 training steps, accuracy is approximately 12.7%.
* At 200 training steps, accuracy is approximately 13.5%.
### Key Observations
* The "Difficulty" level shows the most significant improvement in accuracy with increasing training steps.
* The "Simple" level shows the least improvement in accuracy with increasing training steps.
* The "Medium" level shows a moderate improvement in accuracy with increasing training steps.
* All three levels show an upward trend, indicating that the model learns and improves its accuracy as it is trained.
### Interpretation
The chart illustrates the impact of training steps on the accuracy of a model across different competition levels. The "Difficulty" level benefits the most from increased training, suggesting that the model requires more training to master complex tasks. The "Simple" level shows minimal improvement, possibly indicating that the model quickly reaches its maximum potential for easier tasks. The "Medium" level falls in between, showing a moderate improvement with training. This data suggests that the model's learning rate and potential are influenced by the difficulty of the competition level.