\n
## Charts/Graphs: Equation Learning and Transfer Task Results
### Overview
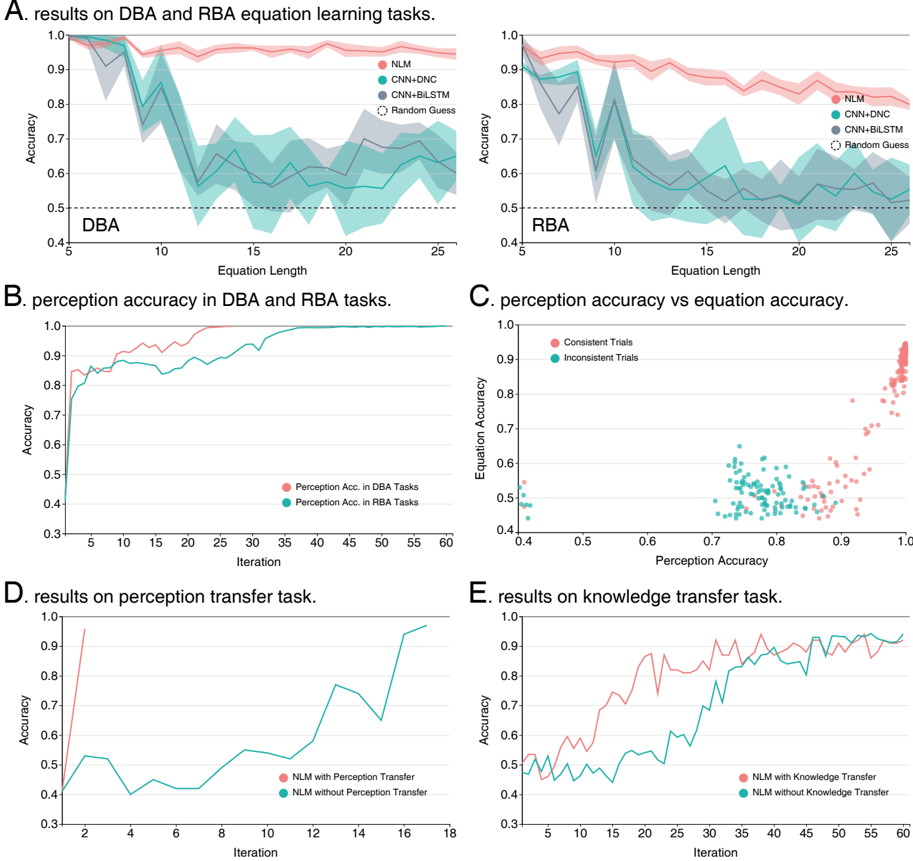
The image presents five separate charts (A-E) illustrating the results of experiments involving equation learning and transfer tasks. Charts A and B focus on DBA (Dynamic Bayesian Association) and RBA (Recurrent Bayesian Association) tasks, while charts C, D, and E explore perception and knowledge transfer. The charts primarily use line plots to display accuracy as a function of equation length or iteration.
### Components/Axes
* **Chart A (DBA):**
* X-axis: Equation Length (ranging from approximately 5 to 25)
* Y-axis: Accuracy (ranging from approximately 0.4 to 1.0)
* Legend:
* NLM (Blue)
* CNN+DNC (Green)
* CNN+BiLSTM (Red)
* Random Guess (Black dashed)
* **Chart B (RBA):**
* X-axis: Equation Length (ranging from approximately 5 to 25)
* Y-axis: Accuracy (ranging from approximately 0.4 to 1.0)
* Legend:
* NLM (Blue)
* CNN+DNC (Green)
* CNN+BiLSTM (Red)
* Random Guess (Black dashed)
* **Chart C (Perception Accuracy vs Equation Accuracy):**
* X-axis: Perception Accuracy (ranging from approximately 0.4 to 1.0)
* Y-axis: Equation Accuracy (ranging from approximately 0.4 to 1.0)
* Legend:
* Consistent Trials (Blue)
* Inconsistent Trials (Red)
* **Chart D (Results on Perception Transfer Task):**
* X-axis: Iteration (ranging from approximately 2 to 18)
* Y-axis: Accuracy (ranging from approximately 0.3 to 1.0)
* Legend:
* NLM with Perception Transfer (Green)
* NLM without Perception Transfer (Blue)
* **Chart E (Results on Knowledge Transfer Task):**
* X-axis: Iteration (ranging from approximately 3 to 60)
* Y-axis: Accuracy (ranging from approximately 0.3 to 1.0)
* Legend:
* NLM with Knowledge Transfer (Green)
* NLM without Knowledge Transfer (Blue)
### Detailed Analysis or Content Details
**Chart A (DBA):**
* NLM (Blue): Line starts at approximately 0.45 at equation length 5, rises to approximately 0.85 at equation length 15, and plateaus around 0.88-0.90 for lengths greater than 15.
* CNN+DNC (Green): Line starts at approximately 0.45 at equation length 5, rises steadily to approximately 0.75 at equation length 15, and continues to rise to approximately 0.85 at equation length 25.
* CNN+BiLSTM (Red): Line starts at approximately 0.45 at equation length 5, rises to approximately 0.70 at equation length 10, and plateaus around 0.70-0.75 for lengths greater than 10.
* Random Guess (Black dashed): Line is flat at approximately 0.4.
**Chart B (RBA):**
* NLM (Blue): Line starts at approximately 0.45 at equation length 5, rises to approximately 0.9 at equation length 15, and plateaus around 0.9.
* CNN+DNC (Green): Line starts at approximately 0.45 at equation length 5, rises to approximately 0.75 at equation length 15, and continues to rise to approximately 0.85 at equation length 25.
* CNN+BiLSTM (Red): Line starts at approximately 0.45 at equation length 5, rises to approximately 0.70 at equation length 10, and plateaus around 0.70-0.75 for lengths greater than 10.
* Random Guess (Black dashed): Line is flat at approximately 0.4.
**Chart C (Perception Accuracy vs Equation Accuracy):**
* Consistent Trials (Blue): Data points are clustered around a diagonal line, indicating a strong positive correlation between perception and equation accuracy. Points range from approximately (0.4, 0.4) to (1.0, 1.0).
* Inconsistent Trials (Red): Data points are more scattered, with a weaker correlation. Points are generally below the diagonal line, suggesting lower equation accuracy for a given perception accuracy. Points range from approximately (0.4, 0.4) to (1.0, 0.8).
**Chart D (Perception Transfer Task):**
* NLM with Perception Transfer (Green): Line starts at approximately 0.35 at iteration 2, rises rapidly to approximately 0.9 at iteration 8, and plateaus around 0.9.
* NLM without Perception Transfer (Blue): Line starts at approximately 0.35 at iteration 2, rises slowly to approximately 0.6 at iteration 18.
**Chart E (Knowledge Transfer Task):**
* NLM with Knowledge Transfer (Green): Line starts at approximately 0.35 at iteration 3, rises rapidly to approximately 0.9 at iteration 20, and plateaus around 0.9.
* NLM without Knowledge Transfer (Blue): Line starts at approximately 0.35 at iteration 3, rises slowly to approximately 0.6 at iteration 60.
### Key Observations
* In both DBA and RBA tasks (Charts A & B), NLM consistently outperforms CNN+DNC and CNN+BiLSTM, especially for longer equation lengths.
* Chart C shows a clear positive correlation between perception and equation accuracy for consistent trials, but this correlation is weaker for inconsistent trials.
* Perception transfer (Chart D) and knowledge transfer (Chart E) significantly improve the accuracy of NLM, with the green lines consistently above the blue lines.
### Interpretation
The data suggests that NLM is a more effective model for equation learning in both DBA and RBA tasks, particularly as equation length increases. The strong correlation between perception and equation accuracy in consistent trials (Chart C) indicates that accurate perception is crucial for successful equation solving. The substantial improvement in accuracy achieved through perception and knowledge transfer (Charts D & E) highlights the benefits of leveraging prior knowledge and perceptual abilities in these tasks. The difference between consistent and inconsistent trials in Chart C suggests that the consistency of the input data plays a significant role in the model's ability to learn and generalize. The relatively flat performance of the "without transfer" lines in Charts D and E indicates that the transfer mechanisms are essential for achieving high accuracy. The consistent performance of the random guess line at 0.4 across charts A and B provides a baseline for evaluating the performance of the models.