# Technical Document Extraction: Heatmap Analysis of K₁ and K₂ Systems
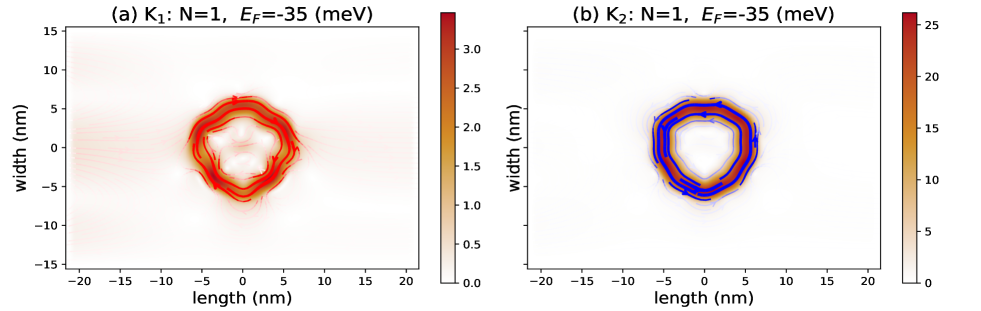
## Panel (a): K₁, N=1, E_F=-35 meV
### Axis Labels
- **X-axis**: `length (nm)` (range: -20 to 20 nm)
- **Y-axis**: `width (nm)` (range: -15 to 15 nm)
### Color Scale
- **Legend**: Right-aligned color bar with values from `0.0` to `3.0` (unitless intensity scale).
- **Color Gradient**:
- `White` (low intensity) → `Yellow` → `Orange` → `Red` (high intensity).
### Key Observations
- **Central Peak**: A high-intensity region (red/orange) centered at `(length=0, width=0)`.
- **Symmetry**: Radial symmetry with concentric intensity rings.
- **Intensity Distribution**:
- Maximum intensity: ~3.0 (red core).
- Outer regions: Gradual decline to ~0.0 (white).
---
## Panel (b): K₂, N=1, E_F=-35 meV
### Axis Labels
- **X-axis**: `length (nm)` (range: -20 to 20 nm)
- **Y-axis**: `width (nm)` (range: -15 to 15 nm)
### Color Scale
- **Legend**: Right-aligned color bar with values from `0` to `25` (unitless intensity scale).
- **Color Gradient**:
- `White` (low intensity) → `Yellow` → `Orange` → `Red` (high intensity).
### Key Observations
- **Complex Structure**:
- Central void (low intensity, white) surrounded by alternating high/low intensity regions.
- Outer ring: High-intensity (red) with a secondary blue ring (lower intensity).
- **Intensity Distribution**:
- Maximum intensity: ~25 (red outer ring).
- Blue ring: Intermediate intensity (~10–15).
- Central void: Near-zero intensity.
---
## Cross-Reference: Color Legend Consistency
| Panel | Color (Red) | Color (Blue) | Notes |
|-------|-------------|--------------|-------|
| (a) | 3.0 | N/A | Single-peak symmetry. |
| (b) | 25 | ~10–15 | Multi-peak structure with void. |
## Notes
- Both panels share identical axis ranges and energy parameters (`E_F=-35 meV`, `N=1`).
- Panel (b) exhibits significantly higher intensity values (up to 25 vs. 3.0 in (a)), suggesting differing system properties or measurement scales.
- The blue ring in (b) may indicate a secondary feature or interference effect.