## Bar Chart: Prediction Flip Rate Comparison for Llama Models
### Overview
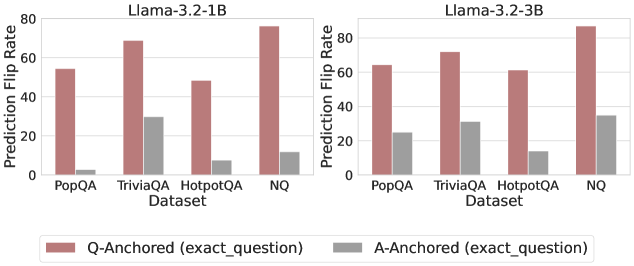
The image presents two bar charts comparing the prediction flip rates of two Llama models (Llama-3.2-1B and Llama-3.2-3B) across four different datasets: PopQA, TriviaQA, HotpotQA, and NQ. The charts compare the flip rates when anchoring on the question (Q-Anchored) versus anchoring on the answer (A-Anchored).
### Components/Axes
* **Titles:**
* Left Chart: Llama-3.2-1B
* Right Chart: Llama-3.2-3B
* **Y-Axis:** Prediction Flip Rate, ranging from 0 to 80.
* **X-Axis:** Dataset, with categories PopQA, TriviaQA, HotpotQA, and NQ.
* **Legend:** Located at the bottom of the image.
* Q-Anchored (exact\_question): Represented by a muted red/brown color.
* A-Anchored (exact\_question): Represented by a gray color.
### Detailed Analysis
**Left Chart: Llama-3.2-1B**
* **PopQA:**
* Q-Anchored: Approximately 54
* A-Anchored: Approximately 2
* **TriviaQA:**
* Q-Anchored: Approximately 70
* A-Anchored: Approximately 30
* **HotpotQA:**
* Q-Anchored: Approximately 48
* A-Anchored: Approximately 8
* **NQ:**
* Q-Anchored: Approximately 75
* A-Anchored: Approximately 13
**Right Chart: Llama-3.2-3B**
* **PopQA:**
* Q-Anchored: Approximately 65
* A-Anchored: Approximately 24
* **TriviaQA:**
* Q-Anchored: Approximately 72
* A-Anchored: Approximately 31
* **HotpotQA:**
* Q-Anchored: Approximately 61
* A-Anchored: Approximately 13
* **NQ:**
* Q-Anchored: Approximately 84
* A-Anchored: Approximately 34
### Key Observations
* For both models and across all datasets, the Q-Anchored flip rate is significantly higher than the A-Anchored flip rate.
* The NQ dataset consistently shows the highest Q-Anchored flip rate for both models.
* The A-Anchored flip rates are generally low, with TriviaQA showing the highest A-Anchored flip rate compared to other datasets.
* Llama-3.2-3B generally has higher Q-Anchored flip rates than Llama-3.2-1B across all datasets.
### Interpretation
The data suggests that anchoring on the question (Q-Anchored) leads to a higher prediction flip rate compared to anchoring on the answer (A-Anchored) for both Llama models. This could indicate that the models are more sensitive to changes or perturbations in the question compared to the answer. The NQ dataset, which likely contains more complex or nuanced questions, exhibits the highest flip rates, suggesting that the models struggle more with this type of question when the question is perturbed. The difference in flip rates between the two models (Llama-3.2-3B having higher rates) could be attributed to differences in their architecture, training data, or model size. The low A-Anchored flip rates suggest that the models are relatively robust to changes in the answer.