\n
## Bar Chart: Prediction Flip Rate for Llama Models
### Overview
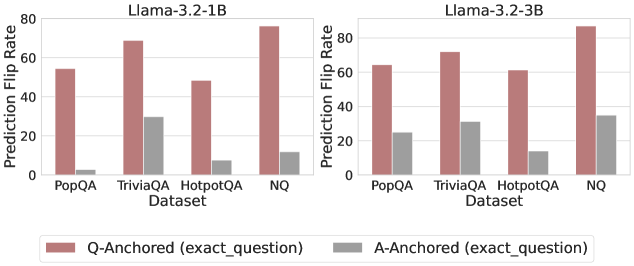
This image presents a comparative bar chart illustrating the Prediction Flip Rate for two Llama models (Llama-3.2-1B and Llama-3.2-3B) across four different datasets: PopQA, TriviaQA, HotpotQA, and NQ. The chart compares the flip rate when the prediction is anchored to the question (Q-Anchored) versus when it's anchored to the answer (A-Anchored). The chart is split into two sections, one for each model.
### Components/Axes
* **X-axis:** Dataset (PopQA, TriviaQA, HotpotQA, NQ)
* **Y-axis:** Prediction Flip Rate (ranging from 0 to 80)
* **Models:** Llama-3.2-1B (left chart), Llama-3.2-3B (right chart)
* **Legend:**
* Q-Anchored (exact\_question) - represented by a reddish-brown color.
* A-Anchored (exact\_question) - represented by a gray color.
### Detailed Analysis
**Llama-3.2-1B (Left Chart)**
* **PopQA:** Q-Anchored: Approximately 52. A-Anchored: Approximately 30.
* **TriviaQA:** Q-Anchored: Approximately 65. A-Anchored: Approximately 32.
* **HotpotQA:** Q-Anchored: Approximately 48. A-Anchored: Approximately 10.
* **NQ:** Q-Anchored: Approximately 78. A-Anchored: Approximately 28.
The Q-Anchored bars consistently show higher flip rates than the A-Anchored bars across all datasets. The trend is that the Q-Anchored flip rate is significantly higher for NQ and TriviaQA, and relatively lower for HotpotQA.
**Llama-3.2-3B (Right Chart)**
* **PopQA:** Q-Anchored: Approximately 58. A-Anchored: Approximately 30.
* **TriviaQA:** Q-Anchored: Approximately 68. A-Anchored: Approximately 32.
* **HotpotQA:** Q-Anchored: Approximately 52. A-Anchored: Approximately 12.
* **NQ:** Q-Anchored: Approximately 80. A-Anchored: Approximately 30.
Similar to the 1B model, the Q-Anchored bars are consistently higher than the A-Anchored bars. The trend is that the Q-Anchored flip rate is significantly higher for NQ and TriviaQA, and relatively lower for HotpotQA.
### Key Observations
* The Q-Anchored flip rate is consistently higher than the A-Anchored flip rate for both models across all datasets.
* The NQ dataset consistently shows the highest Q-Anchored flip rate for both models.
* The HotpotQA dataset consistently shows the lowest Q-Anchored flip rate for both models.
* The 3B model generally exhibits slightly higher Q-Anchored flip rates compared to the 1B model, particularly for PopQA and TriviaQA.
### Interpretation
The data suggests that anchoring the prediction to the question (Q-Anchored) leads to a higher prediction flip rate compared to anchoring it to the answer (A-Anchored) for both Llama models. This implies that the model's predictions are more sensitive to changes in the question formulation than changes in the answer. The significant difference in flip rates across datasets indicates that the models perform differently depending on the nature of the questions and answers within each dataset. The higher flip rates observed in NQ and TriviaQA might suggest that these datasets contain more ambiguous or complex questions, leading to greater variability in predictions. The lower flip rates in HotpotQA could indicate that the questions in this dataset are more straightforward or well-defined. The slight improvement in flip rates with the larger 3B model suggests that increasing model size can lead to increased sensitivity to input variations, but the fundamental pattern of Q-Anchored flip rates being higher than A-Anchored flip rates remains consistent. This could be a characteristic of the model's architecture or training data.