## Bar Chart: Prediction Flip Rate Comparison for Llama-3.2 Models
### Overview
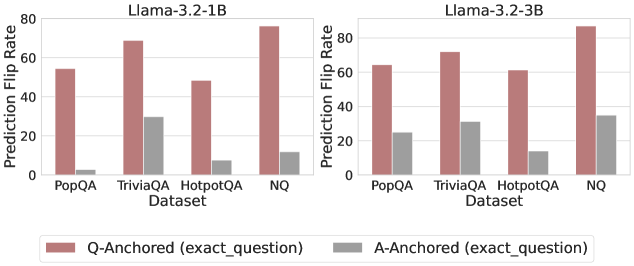
The image presents a comparative bar chart analyzing prediction flip rates for two versions of the Llama-3.2 language model (1B and 3B parameter variants) across four question-answering datasets: PopQA, TriviaQA, HotpotQA, and NQ. The chart contrasts two anchoring methods: Q-Anchored (exact_question) and A-Anchored (exact_question), with distinct color coding for each method.
### Components/Axes
- **X-Axis (Datasets)**: PopQA, TriviaQA, HotpotQA, NQ (left to right)
- **Y-Axis (Prediction Flip Rate)**: Scaled from 0 to 80 in increments of 20
- **Legend**:
- Red bars: Q-Anchored (exact_question)
- Gray bars: A-Anchored (exact_question)
- **Model Labels**:
- Left chart: Llama-3.2-1B
- Right chart: Llama-3.2-3B
### Detailed Analysis
#### Llama-3.2-1B (Left Chart)
- **PopQA**:
- Q-Anchored: ~55%
- A-Anchored: ~2%
- **TriviaQA**:
- Q-Anchored: ~70%
- A-Anchored: ~30%
- **HotpotQA**:
- Q-Anchored: ~50%
- A-Anchored: ~8%
- **NQ**:
- Q-Anchored: ~75%
- A-Anchored: ~12%
#### Llama-3.2-3B (Right Chart)
- **PopQA**:
- Q-Anchored: ~60%
- A-Anchored: ~22%
- **TriviaQA**:
- Q-Anchored: ~65%
- A-Anchored: ~28%
- **HotpotQA**:
- Q-Anchored: ~55%
- A-Anchored: ~12%
- **NQ**:
- Q-Anchored: ~78%
- A-Anchored: ~32%
### Key Observations
1. **Q-Anchored Dominance**: Q-Anchored consistently outperforms A-Anchored across all datasets and models, with flip rates 2-4x higher.
2. **Model Size Correlation**: Llama-3.2-3B shows systematically higher flip rates than Llama-3.2-1B (e.g., NQ Q-Anchored increases from 75% to 78%).
3. **Dataset Variance**: NQ dataset exhibits the highest flip rates for both methods, while PopQA shows the lowest A-Anchored performance.
4. **A-Anchored Limitations**: A-Anchored rates remain below 35% in all cases, suggesting weaker effectiveness compared to Q-Anchored.
### Interpretation
The data demonstrates that Q-Anchored methods significantly influence prediction flips more than A-Anchored approaches, with larger model sizes amplifying this effect. The NQ dataset's high flip rates may reflect its complexity or open-ended nature, making it more susceptible to anchoring effects. The stark contrast between Q and A anchoring suggests that question-level anchoring (Q-Anchored) is more impactful than answer-level anchoring (A-Anchored) in these models. The 3B model's improved performance across datasets implies that increased parameter count enhances sensitivity to anchoring strategies, potentially indicating better contextual understanding or reasoning capabilities.