# Technical Document Extraction
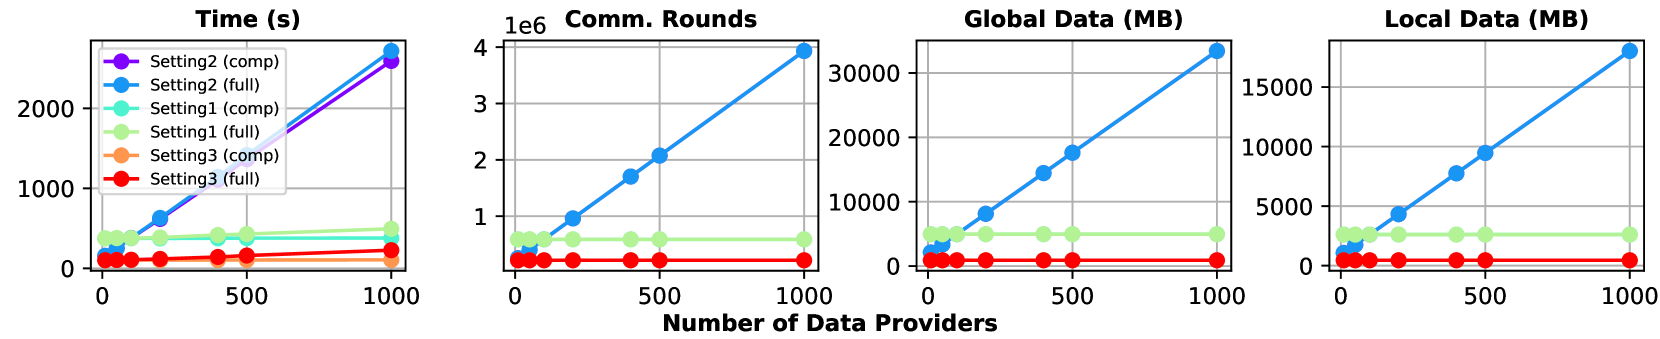
## Graph 1: Time (s) vs. Number of Data Providers
- **Axes**:
- **Y-axis**: Time (s) [0, 1000, 2000]
- **X-axis**: Number of Data Providers [0, 500, 1000]
- **Legend**:
- **Setting2 (comp)**: Purple line
- **Setting2 (full)**: Blue line
- **Setting1 (comp)**: Cyan line
- **Setting1 (full)**: Green line
- **Setting3 (comp)**: Orange line
- **Setting3 (full)**: Red line
- **Trends**:
- **Setting2 (full)**: Sharp linear increase (from ~10s to ~2500s as providers scale from 0 to 1000).
- **Setting2 (comp)**: Slightly slower increase (from ~20s to ~2200s).
- **Setting1 (comp/full)**: Flat (~50s to ~500s).
- **Setting3 (comp/full)**: Flat (~10s to ~30s).
## Graph 2: Communication Rounds (1e6) vs. Number of Data Providers
- **Axes**:
- **Y-axis**: Comm. Rounds (1e6) [0, 1e6, 2e6, 3e6, 4e6]
- **X-axis**: Number of Data Providers [0, 500, 1000]
- **Legend**:
- **Setting2 (full)**: Blue line
- **Setting1 (full)**: Green line
- **Setting3 (full)**: Red line
- **Trends**:
- **Setting2 (full)**: Linear increase (from ~0.5e6 to ~4e6).
- **Setting1 (full)**: Flat (~0.8e6).
- **Setting3 (full)**: Flat (~0.1e6).
## Graph 3: Global Data (MB) vs. Number of Data Providers
- **Axes**:
- **Y-axis**: Global Data (MB) [0, 10,000, 20,000, 30,000]
- **X-axis**: Number of Data Providers [0, 500, 1000]
- **Legend**:
- **Setting2 (full)**: Blue line
- **Setting1 (full)**: Green line
- **Setting3 (full)**: Red line
- **Trends**:
- **Setting2 (full)**: Linear increase (from ~5MB to ~30,000MB).
- **Setting1 (full)**: Flat (~5,000MB).
- **Setting3 (full)**: Flat (~1,000MB).
## Graph 4: Local Data (MB) vs. Number of Data Providers
- **Axes**:
- **Y-axis**: Local Data (MB) [0, 5,000, 10,000, 15,000]
- **X-axis**: Number of Data Providers [0, 500, 1000]
- **Legend**:
- **Setting2 (full)**: Blue line
- **Setting1 (full)**: Green line
- **Setting3 (full)**: Red line
- **Trends**:
- **Setting2 (full)**: Linear increase (from ~2MB to ~15,000MB).
- **Setting1 (full)**: Flat (~5,000MB).
- **Setting3 (full)**: Flat (~1,000MB).
## Key Observations
1. **Setting2 (full)** consistently scales with the number of data providers across all metrics (time, communication rounds, global/local data).
2. **Setting1 (full/comp)** and **Setting3 (full/comp)** exhibit flat performance, indicating no dependency on the number of providers.
3. **Setting2 (comp)** in Graph 1 shows reduced scalability compared to **Setting2 (full)**.