## Line Chart: Hits@1 vs. Mislabeled Edge Probability
### Overview
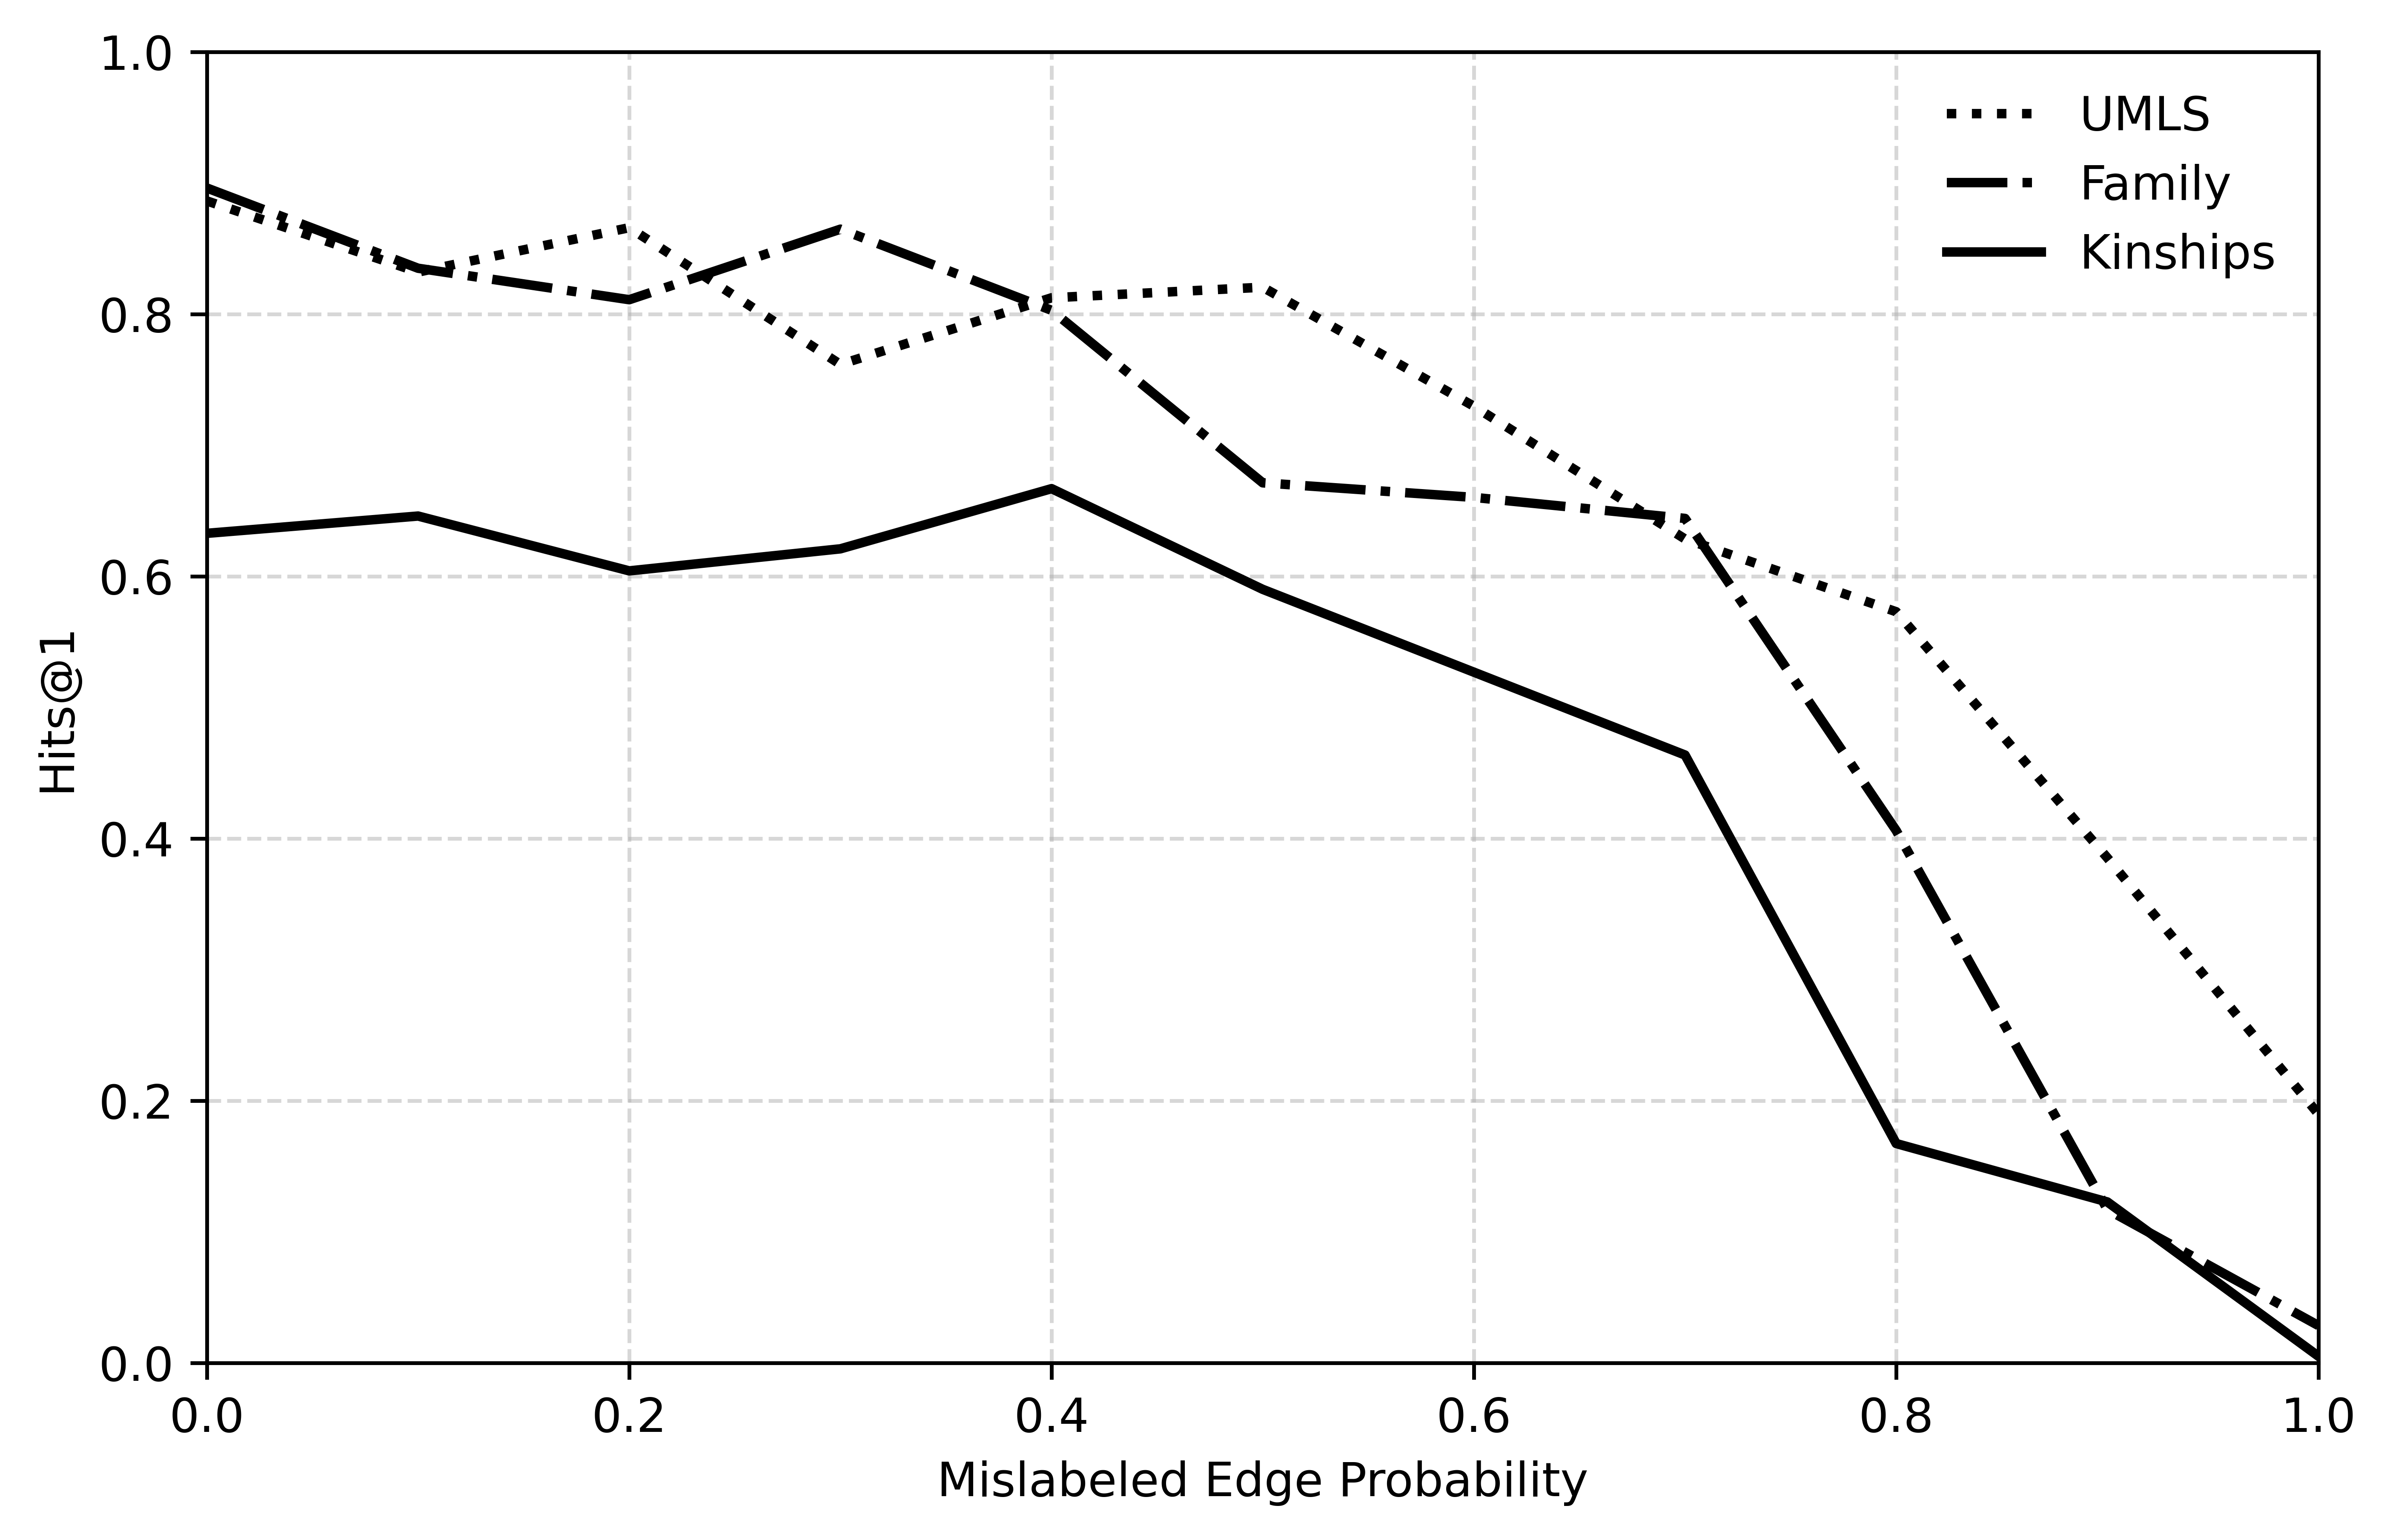
The image is a line chart comparing the performance (Hits@1) of three different knowledge graph datasets (UMLS, Family, Kinships) as the probability of mislabeled edges increases. The x-axis represents the "Mislabeled Edge Probability," ranging from 0.0 to 1.0. The y-axis represents "Hits@1," ranging from 0.0 to 1.0. The chart includes grid lines for easier reading of the data points.
### Components/Axes
* **X-axis:** "Mislabeled Edge Probability" with values ranging from 0.0 to 1.0 in increments of 0.2.
* **Y-axis:** "Hits@1" with values ranging from 0.0 to 1.0 in increments of 0.2.
* **Legend:** Located in the top-right corner, it identifies the three datasets:
* UMLS (dotted line)
* Family (dash-dotted line)
* Kinships (solid line)
### Detailed Analysis
* **UMLS (dotted line):**
* Trend: Generally decreasing as the mislabeled edge probability increases.
* Data Points:
* At 0.0 Mislabeled Edge Probability, Hits@1 is approximately 0.9.
* At 0.2 Mislabeled Edge Probability, Hits@1 is approximately 0.85.
* At 0.4 Mislabeled Edge Probability, Hits@1 is approximately 0.82.
* At 0.6 Mislabeled Edge Probability, Hits@1 is approximately 0.75.
* At 0.8 Mislabeled Edge Probability, Hits@1 is approximately 0.58.
* At 1.0 Mislabeled Edge Probability, Hits@1 is approximately 0.2.
* **Family (dash-dotted line):**
* Trend: Relatively stable until 0.6, then decreases sharply.
* Data Points:
* At 0.0 Mislabeled Edge Probability, Hits@1 is approximately 0.89.
* At 0.2 Mislabeled Edge Probability, Hits@1 is approximately 0.81.
* At 0.4 Mislabeled Edge Probability, Hits@1 is approximately 0.86.
* At 0.6 Mislabeled Edge Probability, Hits@1 is approximately 0.67.
* At 0.8 Mislabeled Edge Probability, Hits@1 is approximately 0.16.
* At 1.0 Mislabeled Edge Probability, Hits@1 is approximately 0.03.
* **Kinships (solid line):**
* Trend: Initially slightly increasing, then decreasing.
* Data Points:
* At 0.0 Mislabeled Edge Probability, Hits@1 is approximately 0.63.
* At 0.2 Mislabeled Edge Probability, Hits@1 is approximately 0.61.
* At 0.4 Mislabeled Edge Probability, Hits@1 is approximately 0.67.
* At 0.6 Mislabeled Edge Probability, Hits@1 is approximately 0.58.
* At 0.8 Mislabeled Edge Probability, Hits@1 is approximately 0.46.
* At 1.0 Mislabeled Edge Probability, Hits@1 is approximately 0.02.
### Key Observations
* All three datasets show a decrease in performance (Hits@1) as the mislabeled edge probability increases.
* The "Family" dataset experiences a sharp decline in performance after a mislabeled edge probability of 0.6.
* The "Kinships" dataset shows a more gradual decline in performance compared to "Family."
* The "UMLS" dataset maintains a relatively higher Hits@1 compared to the other two datasets, especially at higher mislabeled edge probabilities.
### Interpretation
The chart illustrates the impact of noisy data (mislabeled edges) on the performance of knowledge graph-based systems. The "Hits@1" metric measures the accuracy of retrieving relevant information. The data suggests that the "Family" dataset is more sensitive to mislabeled edges than "UMLS." The "Kinships" dataset shows a moderate sensitivity. This could be due to differences in the structure, size, or inherent noise levels of the datasets. The results highlight the importance of data quality and noise reduction techniques in knowledge graph applications.