## Line Chart: Hits@1 vs. Mislabeled Edge Probability
### Overview
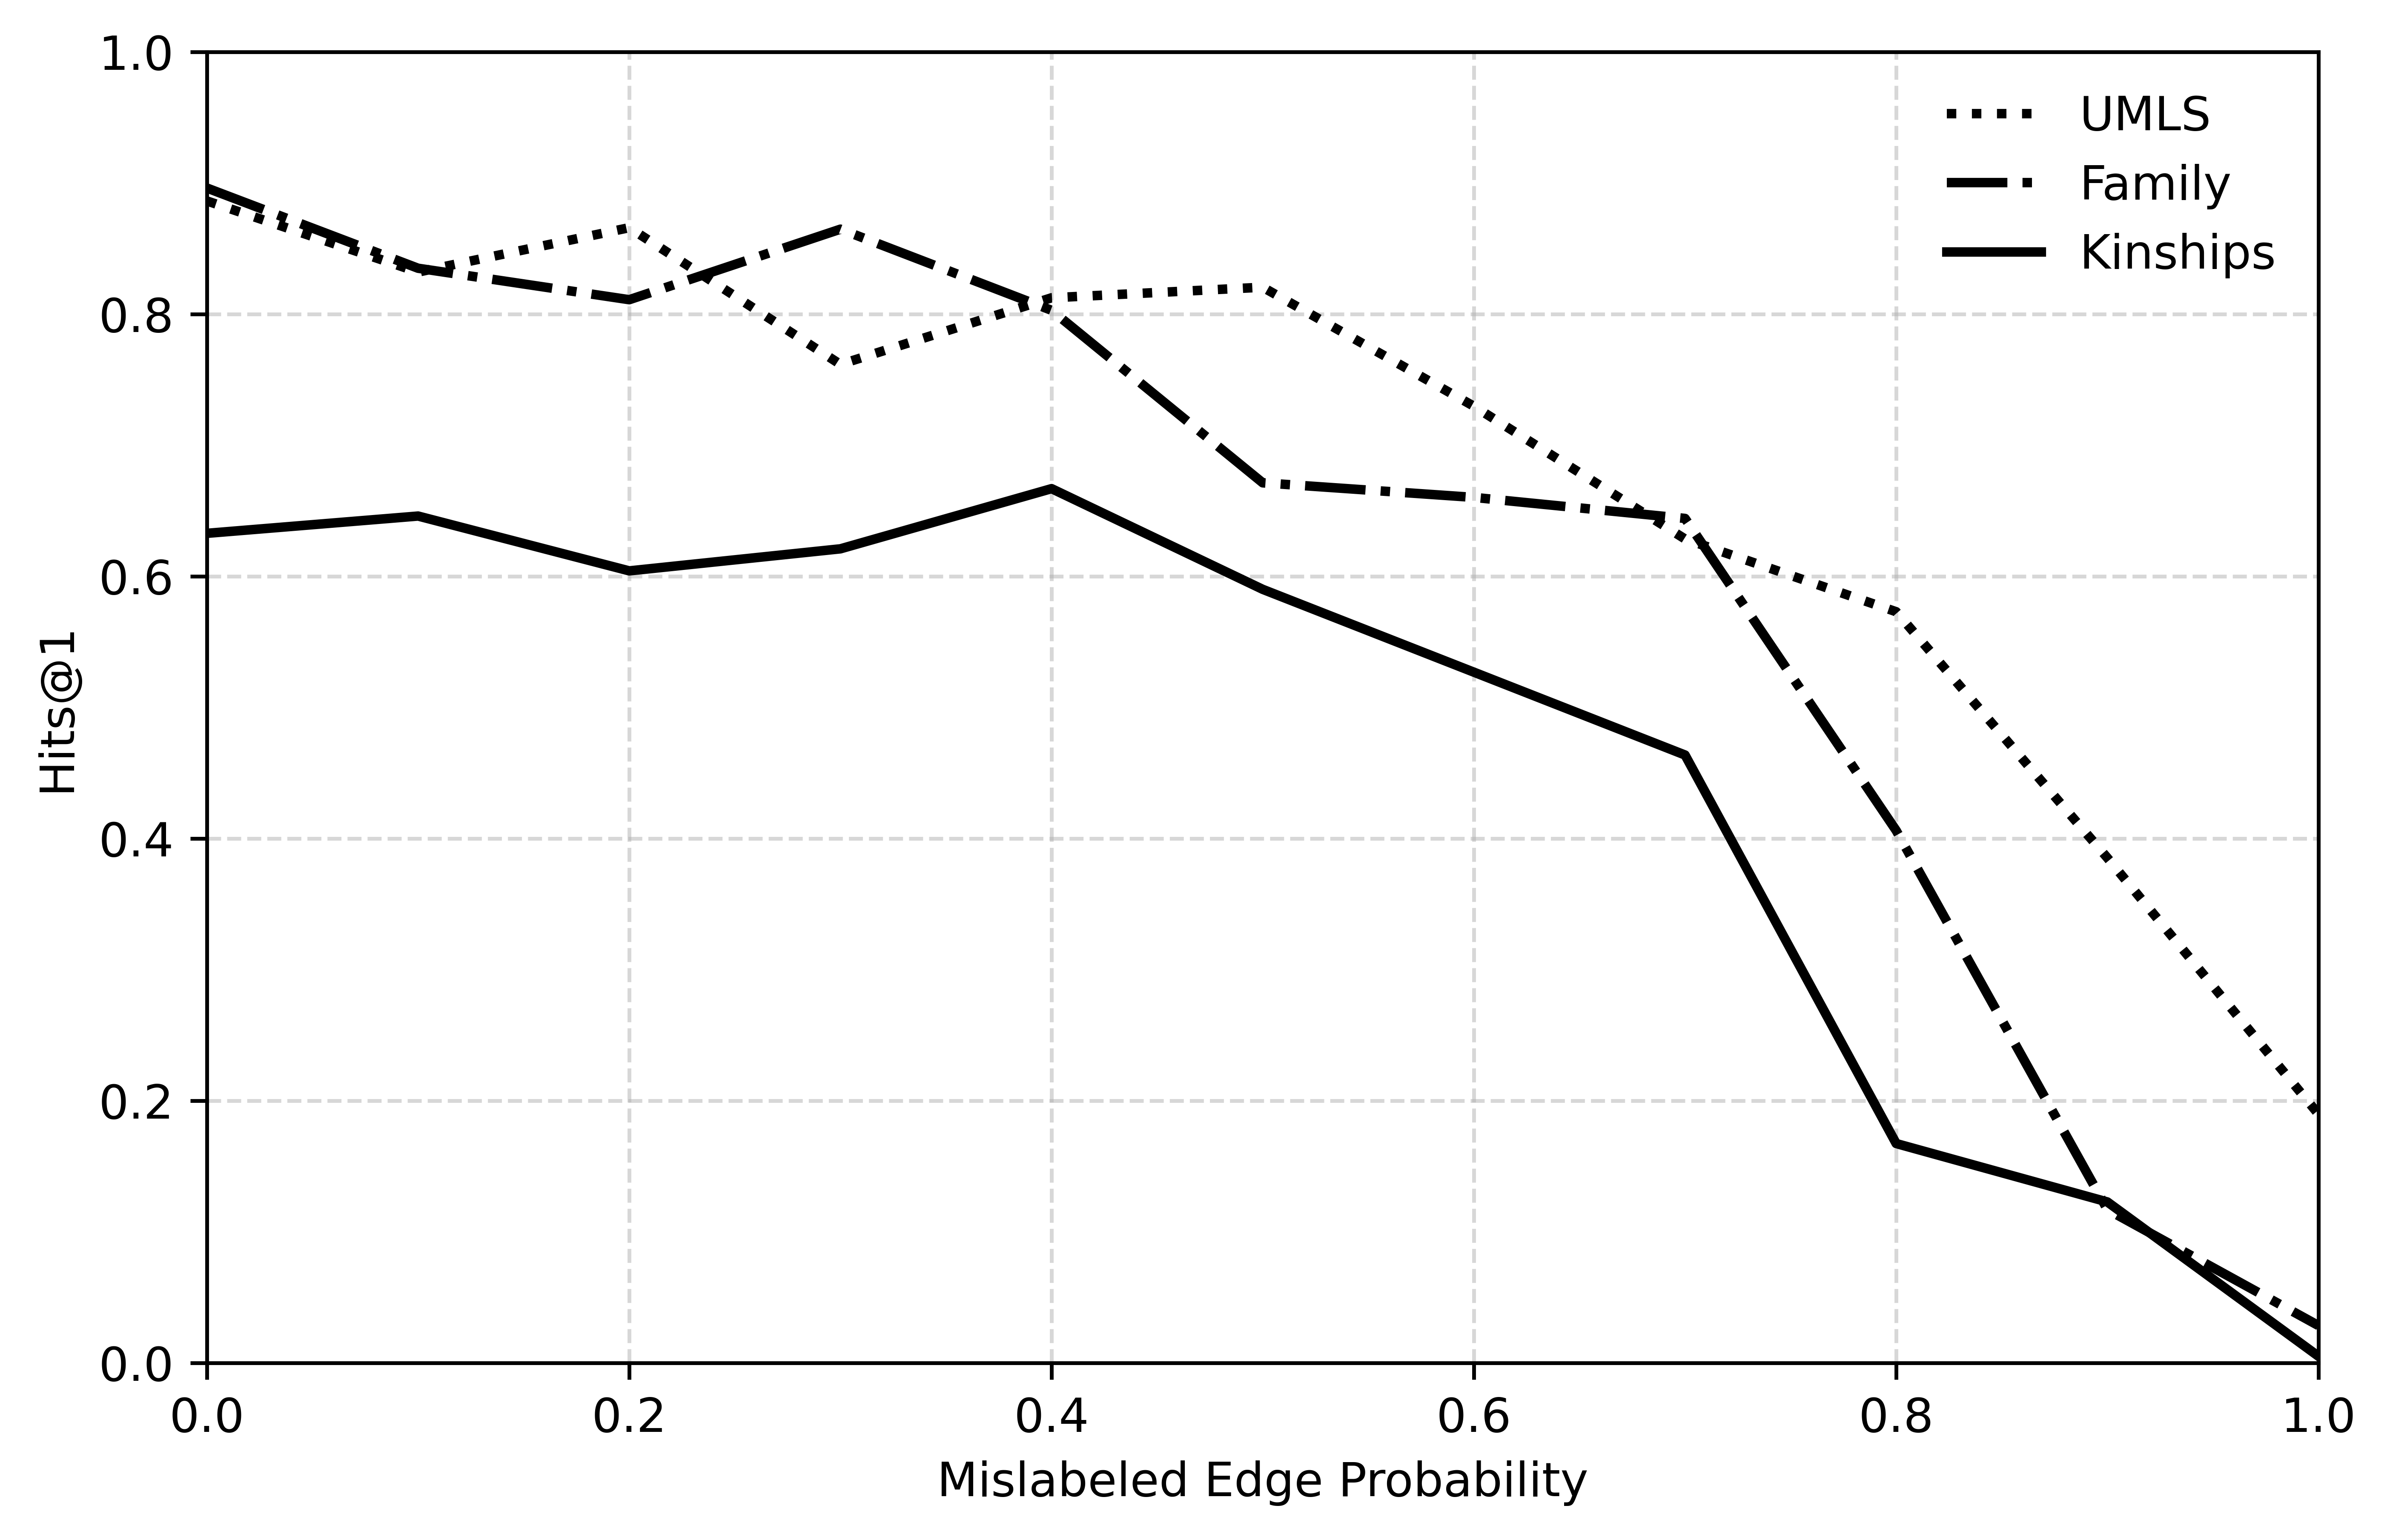
This chart illustrates the performance degradation of three distinct datasets (UMLS, Family, and Kinships) in a link prediction or classification task as the level of noise—defined as "Mislabeled Edge Probability"—increases from 0.0 to 1.0. The Y-axis represents the "Hits@1" metric, a standard measure of accuracy in knowledge graph completion tasks.
### Components/Axes
* **X-Axis:** "Mislabeled Edge Probability" (Range: 0.0 to 1.0).
* **Y-Axis:** "Hits@1" (Range: 0.0 to 1.0).
* **Legend (Top-Right):**
* **Dotted Line:** UMLS
* **Dash-dot Line:** Family
* **Solid Line:** Kinships
### Detailed Analysis
The following data points are estimated based on visual inspection of the chart.
| Mislabeled Edge Probability | UMLS (Dotted) | Family (Dash-dot) | Kinships (Solid) |
| :--- | :--- | :--- | :--- |
| **0.0** | ~0.89 | ~0.90 | ~0.63 |
| **0.1** | ~0.84 | ~0.84 | ~0.65 |
| **0.2** | ~0.87 | ~0.81 | ~0.60 |
| **0.3** | ~0.77 | ~0.87 | ~0.62 |
| **0.4** | ~0.81 | ~0.81 | ~0.67 |
| **0.5** | ~0.82 | ~0.67 | ~0.59 |
| **0.6** | ~0.73 | ~0.66 | ~0.53 |
| **0.7** | ~0.64 | ~0.64 | ~0.47 |
| **0.8** | ~0.57 | ~0.40 | ~0.17 |
| **0.9** | ~0.38 | ~0.12 | ~0.12 |
| **1.0** | ~0.19 | ~0.03 | ~0.01 |
**Trend Verification:**
* **UMLS (Dotted):** Exhibits the highest overall robustness. It maintains a relatively high performance (above 0.7) until the probability exceeds 0.6, after which it declines steadily.
* **Family (Dash-dot):** Starts with the highest performance at 0.0 probability (~0.90). It remains stable until 0.4, then begins a gradual decline, followed by a sharp "cliff" drop between 0.7 and 0.9.
* **Kinships (Solid):** Starts with the lowest baseline performance (~0.63). It shows a slight fluctuation between 0.0 and 0.4, followed by a steady decline, with a significant drop-off occurring between 0.7 and 0.8.
### Key Observations
* **Robustness Hierarchy:** UMLS is the most resilient dataset to mislabeled edges. Even at 0.8 probability, it retains a Hits@1 score of ~0.57, whereas the other two datasets have already dropped below 0.4.
* **The "Cliff" Effect:** Both the Family and Kinships datasets experience a dramatic loss in predictive accuracy once the mislabeled edge probability exceeds 0.7.
* **Convergence:** All three datasets converge toward a Hits@1 score near 0.0 as the mislabeled edge probability approaches 1.0 (total noise).
* **Anomalous Behavior:** The Family dataset shows a slight increase in performance at 0.3 probability compared to 0.2, which is counter-intuitive for a noise-injection test, suggesting potential variance in the underlying data structure or sampling.
### Interpretation
This chart demonstrates the sensitivity of link prediction models to data quality. The "Mislabeled Edge Probability" acts as a stress test for the model's ability to generalize.
The data suggests that the **UMLS** dataset possesses a more robust structural topology, allowing the model to maintain predictive accuracy even when a significant portion of the edges are incorrect. Conversely, the **Family** and **Kinships** datasets appear to rely more heavily on the specific correctness of the edges; once the noise level crosses a critical threshold (roughly 0.7), the model's ability to distinguish valid relationships from noise collapses. This indicates that for these datasets, the model is likely overfitting to specific edge patterns that are easily disrupted by noise.