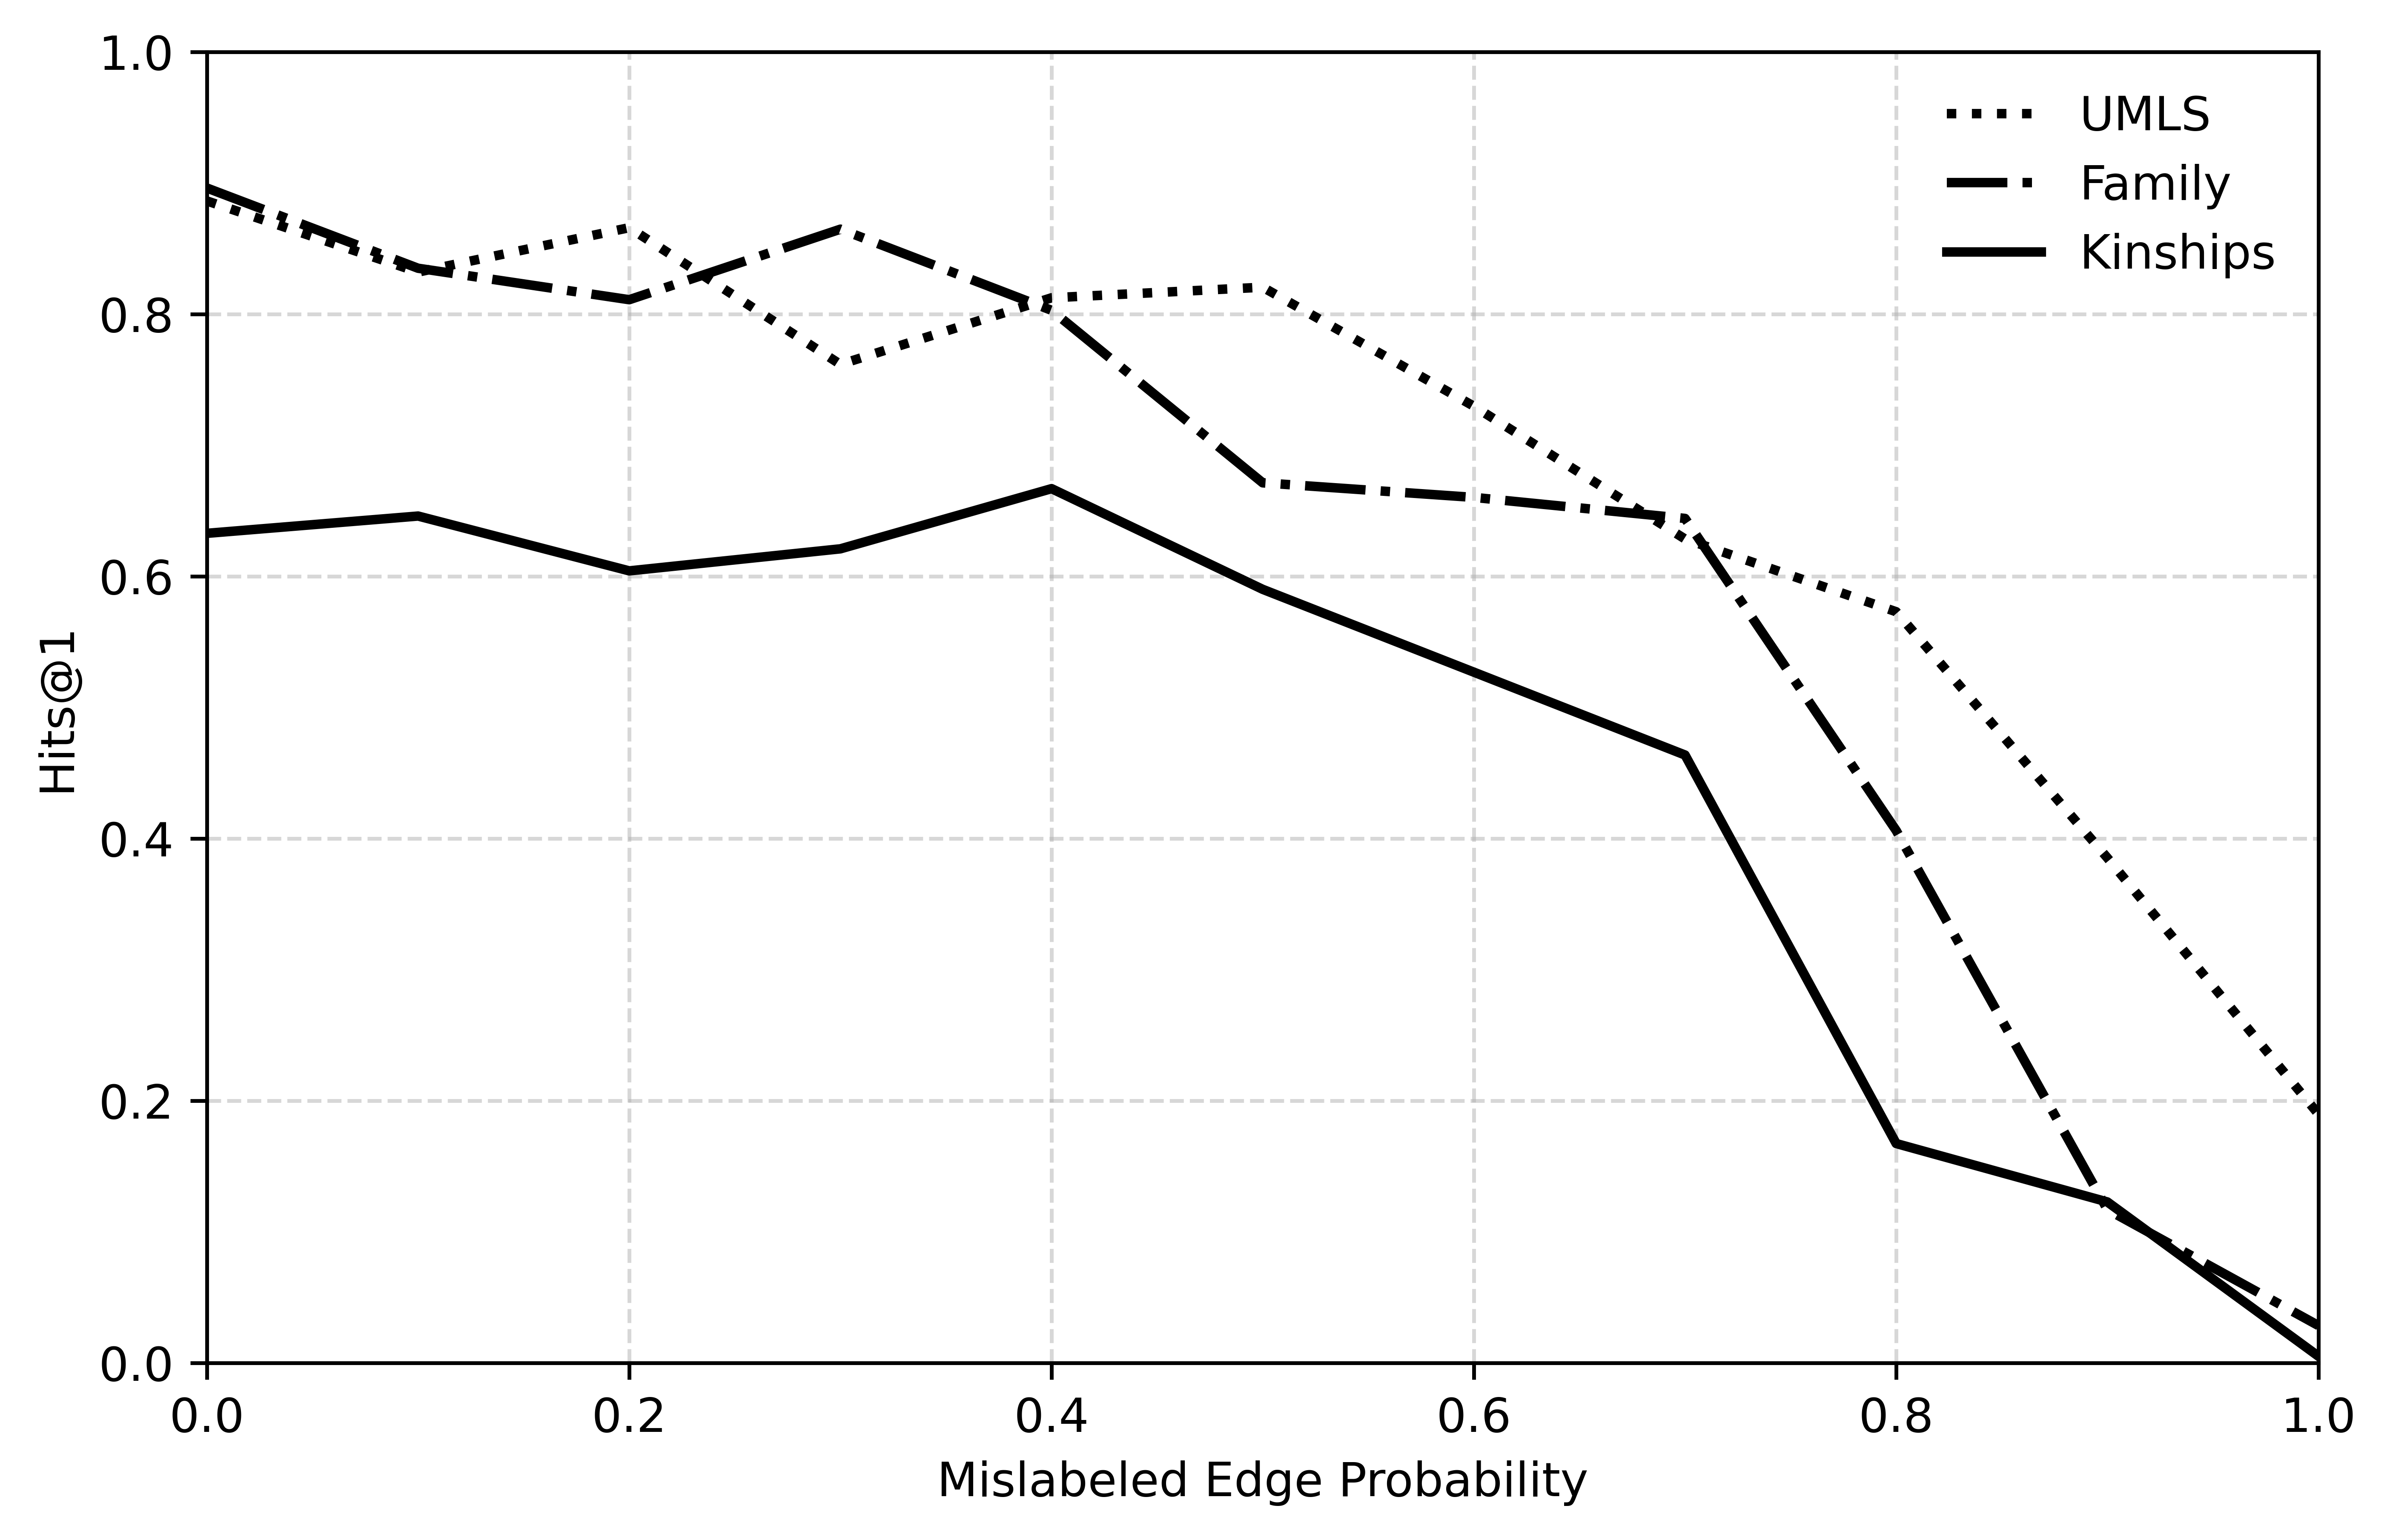
## Line Graph: Hits@1 vs. Mislabeled Edge Probability
### Overview
The image is a line graph comparing three data series (UMLS, Family, Kinships) across a range of mislabeled edge probabilities (0.0 to 1.0). The y-axis represents Hits@1 (proportion of correct predictions), while the x-axis represents the probability of edge mislabeling. All lines exhibit declining trends, but with distinct patterns.
### Components/Axes
- **X-axis**: "Mislabeled Edge Probability" (0.0 to 1.0 in increments of 0.2).
- **Y-axis**: "Hits@1" (0.0 to 1.0 in increments of 0.2).
- **Legend**: Located in the top-right corner, with three entries:
- **UMLS**: Dotted line (dark gray).
- **Family**: Dashed line (medium gray).
- **Kinships**: Solid line (black).
### Detailed Analysis
1. **UMLS (Dotted Line)**:
- Starts at ~0.9 Hits@1 at 0.0 mislabeled probability.
- Gradually declines to ~0.2 Hits@1 at 1.0 mislabeled probability.
- Trend: Steady, linear decrease with minor fluctuations.
2. **Family (Dashed Line)**:
- Begins at ~0.6 Hits@1 at 0.0 mislabeled probability.
- Peaks at ~0.7 Hits@1 around 0.4 mislabeled probability.
- Sharp decline to ~0.1 Hits@1 at 1.0 mislabeled probability.
- Trend: Initial plateau, followed by a steep drop after 0.4.
3. **Kinships (Solid Line)**:
- Starts at ~0.6 Hits@1 at 0.0 mislabeled probability.
- Remains flat until ~0.4 mislabeled probability.
- Plummets to ~0.05 Hits@1 at 1.0 mislabeled probability.
- Trend: Stable until 0.4, then abrupt collapse.
### Key Observations
- **UMLS** maintains the highest performance across all mislabeled probabilities, suggesting robustness to errors.
- **Family** outperforms Kinships at low mislabeling probabilities (0.0–0.4) but degrades rapidly beyond this threshold.
- **Kinships** shows resilience up to 0.4 mislabeled probability but fails catastrophically beyond this point.
- All lines converge near 0 Hits@1 at 1.0 mislabeled probability, indicating near-total failure under maximum error.
### Interpretation
The graph highlights trade-offs between robustness and sensitivity to mislabeling:
- **UMLS** likely employs a method (e.g., semantic similarity) that generalizes well even with high error rates.
- **Family** may rely on contextual or relational cues that break down under significant mislabeling.
- **Kinships**’ abrupt decline suggests a threshold effect, where a small increase in error probability invalidates its assumptions (e.g., hierarchical relationships).
The data implies that UMLS is the most reliable choice in noisy environments, while Family and Kinships are better suited for scenarios with low mislabeling rates. The sharp drop in Kinships’ performance raises questions about its dependency on precise edge labeling.