## Line Chart: Parallel scaling of verifier compute: MATH-500
### Overview
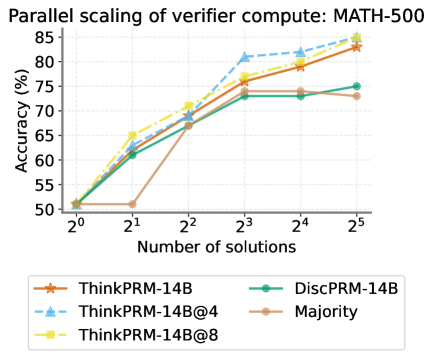
The image is a line chart comparing the accuracy (%) of different models (ThinkPRM-14B, ThinkPRM-14B@4, ThinkPRM-14B@8, DiscPRM-14B, and Majority) against the number of solutions (2^0 to 2^5) for a verifier compute task on MATH-500. The chart illustrates how the accuracy of each model scales with an increasing number of solutions.
### Components/Axes
* **Title:** Parallel scaling of verifier compute: MATH-500
* **X-axis:** Number of solutions (2^0, 2^1, 2^2, 2^3, 2^4, 2^5)
* **Y-axis:** Accuracy (%) (50, 55, 60, 65, 70, 75, 80, 85)
* **Legend:** Located at the bottom of the chart.
* ThinkPRM-14B (brown line with star markers)
* ThinkPRM-14B@4 (light blue dashed line with triangle markers)
* ThinkPRM-14B@8 (yellow dash-dot line with square markers)
* DiscPRM-14B (green line with circle markers)
* Majority (tan line with circle markers)
### Detailed Analysis
* **X-Axis Values:** The x-axis represents the number of solutions, with values at powers of 2: 2^0 (1), 2^1 (2), 2^2 (4), 2^3 (8), 2^4 (16), and 2^5 (32).
* **Y-Axis Values:** The y-axis represents the accuracy in percentage, ranging from 50% to 85% in increments of 5%.
**Data Series Analysis:**
* **ThinkPRM-14B (brown line with star markers):**
* Trend: Generally increasing.
* Data Points:
* 2^0: ~51%
* 2^1: ~51%
* 2^2: ~69%
* 2^3: ~77%
* 2^4: ~79%
* 2^5: ~83%
* **ThinkPRM-14B@4 (light blue dashed line with triangle markers):**
* Trend: Increasing.
* Data Points:
* 2^0: ~51%
* 2^1: ~62%
* 2^2: ~69%
* 2^3: ~81%
* 2^4: ~82%
* 2^5: ~84%
* **ThinkPRM-14B@8 (yellow dash-dot line with square markers):**
* Trend: Increasing.
* Data Points:
* 2^0: ~51%
* 2^1: ~61%
* 2^2: ~69%
* 2^3: ~77%
* 2^4: ~80%
* 2^5: ~83%
* **DiscPRM-14B (green line with circle markers):**
* Trend: Increasing, then plateaus.
* Data Points:
* 2^0: ~51%
* 2^1: ~62%
* 2^2: ~70%
* 2^3: ~73%
* 2^4: ~73%
* 2^5: ~73%
* **Majority (tan line with circle markers):**
* Trend: Stagnant, then increasing.
* Data Points:
* 2^0: ~51%
* 2^1: ~51%
* 2^2: ~69%
* 2^3: ~73%
* 2^4: ~73%
* 2^5: ~73%
### Key Observations
* ThinkPRM-14B@4 generally achieves the highest accuracy across all solution counts.
* DiscPRM-14B and Majority models plateau in accuracy after 2^3 solutions.
* All models start with similar accuracy at 2^0 solutions.
* The accuracy of all models generally increases with the number of solutions, except for DiscPRM-14B and Majority, which plateau.
### Interpretation
The chart demonstrates the parallel scaling performance of different verifier compute models on the MATH-500 dataset. The ThinkPRM-14B variants, especially ThinkPRM-14B@4, show the best scaling behavior, achieving higher accuracy as the number of solutions increases. The DiscPRM-14B and Majority models, however, reach a performance ceiling, suggesting that increasing the number of solutions beyond a certain point does not improve their accuracy. This indicates that the ThinkPRM-14B models are better suited for tasks where a larger number of solutions can be explored to improve verification accuracy. The "@4" and "@8" likely refer to different configurations or parameters within the ThinkPRM-14B model, with "@4" being the most effective in this scenario.