## Line Chart: Parallel Scaling of Verifier Compute - MATH-500
### Overview
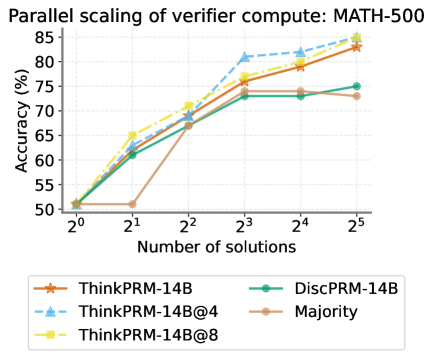
This line chart illustrates the relationship between the number of solutions generated and the accuracy achieved by different verification methods on the MATH-500 dataset. The x-axis represents the number of solutions (on a logarithmic scale), and the y-axis represents the accuracy in percentage. The chart compares the performance of several models: ThinkPRM-14B, ThinkPRM-14B@4, ThinkPRM-14B@8, DiscPRM-14B, and Majority voting.
### Components/Axes
* **Title:** Parallel scaling of verifier compute: MATH-500
* **X-axis Label:** Number of solutions
* **X-axis Scale:** Logarithmic scale, with markers at 2⁰, 2¹, 2², 2³, 2⁴, and 2⁵.
* **Y-axis Label:** Accuracy (%)
* **Y-axis Scale:** Linear scale, ranging from 50% to 85%.
* **Legend:** Located at the bottom of the chart.
* ThinkPRM-14B (Orange)
* ThinkPRM-14B@4 (Light Blue, dashed)
* ThinkPRM-14B@8 (Yellow)
* DiscPRM-14B (Teal)
* Majority (Brown)
### Detailed Analysis
The chart displays five distinct lines, each representing a different verification method.
* **ThinkPRM-14B (Orange):** This line starts at approximately 52% accuracy at 2⁰ solutions, steadily increases to around 78% at 2³ solutions, then continues to rise to approximately 83% at 2⁵ solutions.
* **ThinkPRM-14B@4 (Light Blue, dashed):** This line begins at roughly 52% accuracy at 2⁰ solutions, rapidly increases to approximately 81% at 2² solutions, plateaus around 82% at 2³ and 2⁴ solutions, and then slightly decreases to around 81% at 2⁵ solutions.
* **ThinkPRM-14B@8 (Yellow):** This line starts at approximately 52% accuracy at 2⁰ solutions, increases to around 78% at 2³ solutions, and continues to rise to approximately 84% at 2⁵ solutions.
* **DiscPRM-14B (Teal):** This line begins at approximately 52% accuracy at 2⁰ solutions, increases to around 72% at 2³ solutions, and remains relatively stable at around 73% at 2⁴ and 2⁵ solutions.
* **Majority (Brown):** This line starts at approximately 52% accuracy at 2⁰ solutions, sharply increases to around 68% at 2² solutions, then rises to approximately 73% at 2³ solutions, and decreases to around 71% at 2⁵ solutions.
### Key Observations
* **Performance Improvement with More Solutions:** All methods demonstrate an increase in accuracy as the number of solutions increases, indicating that generating more potential solutions improves verification performance.
* **ThinkPRM-14B@4 Outperforms:** The ThinkPRM-14B@4 model consistently achieves the highest accuracy across most of the solution range, peaking at approximately 82%.
* **Diminishing Returns:** The rate of accuracy improvement appears to diminish as the number of solutions increases, particularly for ThinkPRM-14B@4.
* **Majority Voting is Lowest:** The Majority voting method consistently exhibits the lowest accuracy among the tested models.
* **ThinkPRM-14B and ThinkPRM-14B@8 are similar:** These two lines are very close to each other.
### Interpretation
The data suggests that parallelizing the verification process (as demonstrated by ThinkPRM-14B@4 and ThinkPRM-14B@8) can significantly improve accuracy, especially when a moderate number of solutions are considered. The ThinkPRM-14B@4 model appears to strike a balance between computational cost and accuracy, achieving high performance without requiring a large number of solutions. The diminishing returns observed at higher solution counts suggest that there may be a point where the computational cost of generating additional solutions outweighs the marginal gains in accuracy. The lower performance of the Majority voting method indicates that a more sophisticated verification strategy is necessary for achieving high accuracy on the MATH-500 dataset. The logarithmic scale on the x-axis highlights the importance of scaling the number of solutions to achieve substantial accuracy improvements. The consistent starting point of all lines at approximately 52% suggests a baseline accuracy level inherent to the problem or the initial solution generation process.