## Line Graphs: Test Cross-Entropy Loss vs. Training Tokens Across Model Sizes
### Overview
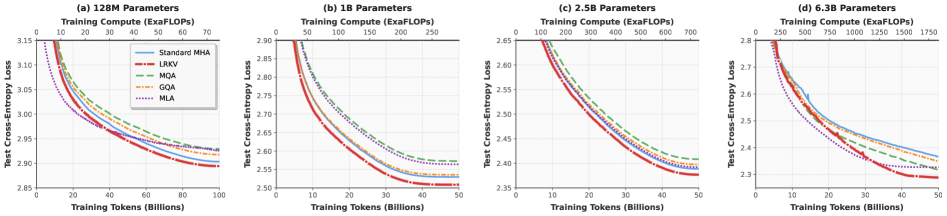
The image contains four line graphs (a-d) comparing the performance of different training methods (Standard MHA, LRKV, MQA, GQA, MLA) across four model sizes (128M, 1B, 2.5B, 6.3B parameters). Each graph plots **Test Cross-Entropy Loss** (y-axis) against **Training Tokens (Billions)** (x-axis), with distinct line styles/colors for each method. All graphs show a general downward trend in loss as training tokens increase, with convergence patterns varying by model size.
---
### Components/Axes
#### Common Elements Across All Graphs:
- **X-axis**: Training Tokens (Billions), ranging from 0 to 100 (a), 0–50 (b), 0–70 (c), and 0–1750 (d).
- **Y-axis**: Test Cross-Entropy Loss, ranging from ~2.85–3.15 (a), ~2.5–2.9 (b), ~2.35–2.65 (c), and ~2.3–2.8 (d).
- **Legend**: Located in the top-left corner of each graph, with five methods:
- **Standard MHA**: Solid blue line
- **LRKV**: Solid red line
- **MQA**: Dashed green line
- **GQA**: Dashed orange line
- **MLA**: Dotted purple line
#### Graph-Specific Details:
- **(a) 128M Parameters**: X-axis spans 0–100B tokens; y-axis loss starts near 3.15 and drops to ~2.9.
- **(b) 1B Parameters**: X-axis spans 0–50B tokens; y-axis loss starts near 2.9 and drops to ~2.55.
- **(c) 2.5B Parameters**: X-axis spans 0–70B tokens; y-axis loss starts near 2.65 and drops to ~2.4.
- **(d) 6.3B Parameters**: X-axis spans 0–1750B tokens; y-axis loss starts near 2.8 and drops to ~2.3.
---
### Detailed Analysis
#### Graph (a): 128M Parameters
- **Trend**: All methods show steep initial declines, with lines converging toward ~2.9 loss at 100B tokens.
- **Key Data Points**:
- **Standard MHA** (blue): Starts at ~3.15, ends at ~2.9.
- **LRKV** (red): Starts at ~3.1, ends at ~2.9.
- **MQA** (green): Starts at ~3.1, ends at ~2.9.
- **GQA** (orange): Starts at ~3.05, ends at ~2.9.
- **MLA** (purple): Starts at ~3.0, ends at ~2.9.
#### Graph (b): 1B Parameters
- **Trend**: Faster initial decline than (a), with lines converging at ~2.55 loss by 50B tokens.
- **Key Data Points**:
- **Standard MHA**: Starts at ~2.9, ends at ~2.55.
- **LRKV**: Starts at ~2.85, ends at ~2.55.
- **MQA**: Starts at ~2.85, ends at ~2.55.
- **GQA**: Starts at ~2.8, ends at ~2.55.
- **MLA**: Starts at ~2.75, ends at ~2.55.
#### Graph (c): 2.5B Parameters
- **Trend**: Steeper initial drop than (b), with convergence at ~2.4 loss by 70B tokens.
- **Key Data Points**:
- **Standard MHA**: Starts at ~2.65, ends at ~2.4.
- **LRKV**: Starts at ~2.6, ends at ~2.4.
- **MQA**: Starts at ~2.6, ends at ~2.4.
- **GQA**: Starts at ~2.55, ends at ~2.4.
- **MLA**: Starts at ~2.5, ends at ~2.4.
#### Graph (d): 6.3B Parameters
- **Trend**: Most pronounced initial decline, with lines converging at ~2.3 loss by 1750B tokens.
- **Key Data Points**:
- **Standard MHA**: Starts at ~2.8, ends at ~2.3.
- **LRKV**: Starts at ~2.75, ends at ~2.3.
- **MQA**: Starts at ~2.7, ends at ~2.3.
- **GQA**: Starts at ~2.65, ends at ~2.3.
- **MLA**: Starts at ~2.6, ends at ~2.3.
---
### Key Observations
1. **Convergence**: All methods converge to similar loss values at maximum training tokens, suggesting diminishing returns with scale.
2. **MLA Advantage**: MLA (dotted purple) consistently starts with the lowest loss across all model sizes but converges to match others.
3. **Model Size Impact**: Larger models (6.3B) achieve lower final loss than smaller models (128M) despite requiring vastly more training tokens.
4. **Efficiency**: Smaller models (128M) reach near-optimal performance faster (100B tokens) than larger models (6.3B requires 1750B tokens).
---
### Interpretation
The data demonstrates that:
- **Larger models** achieve lower final loss but require disproportionately more compute (e.g., 6.3B needs 17.5x more tokens than 128M).
- **Training methods** like MLA and GQA show early efficiency gains but face diminishing returns, while Standard MHA and LRKV perform comparably across scales.
- The steepest declines in loss occur early in training, suggesting that most learning happens in the initial token ranges. For example, 6.3B models drop ~0.5 loss units in the first 100B tokens but only ~0.1 units in the final 1650B tokens.
This highlights a trade-off between model size and training efficiency, with larger models offering better performance at the cost of significantly higher computational requirements.