## Bar Chart: Overall Accuracy Comparison
### Overview
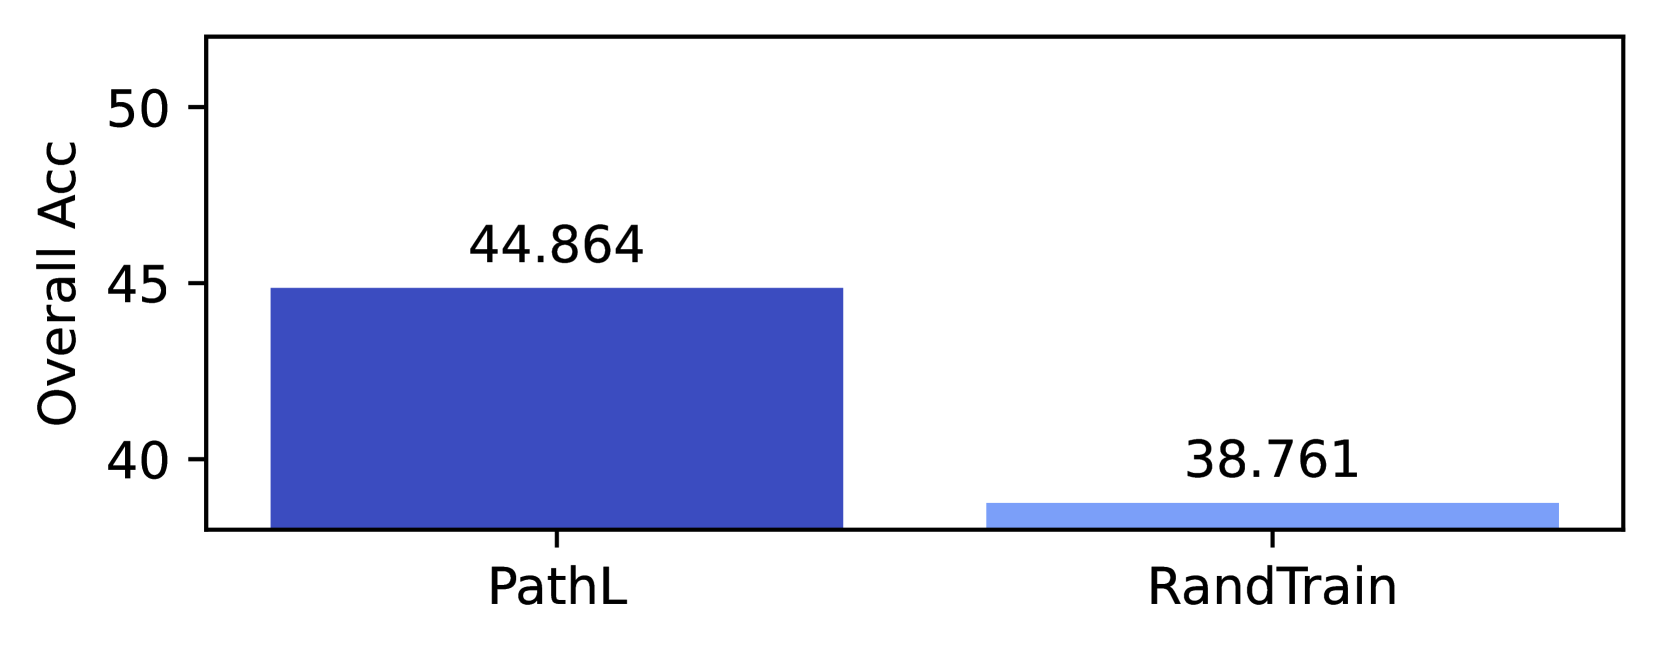
The image is a bar chart comparing the overall accuracy of two methods: PathL and RandTrain. The chart displays the accuracy values for each method using vertical bars. PathL has a significantly higher accuracy than RandTrain.
### Components/Axes
* **Y-axis:** "Overall Acc" (Overall Accuracy). The scale ranges from approximately 38 to 50, with tick marks at 40, 45, and 50.
* **X-axis:** Categorical axis with two categories: "PathL" and "RandTrain".
* **Bars:**
* PathL: A dark blue bar representing the accuracy of the PathL method.
* RandTrain: A light blue bar representing the accuracy of the RandTrain method.
* **Values:** Numerical values are displayed above each bar, indicating the exact accuracy.
### Detailed Analysis
* **PathL:** The dark blue bar for PathL reaches an accuracy of 44.864.
* **RandTrain:** The light blue bar for RandTrain reaches an accuracy of 38.761.
### Key Observations
* PathL has a higher overall accuracy compared to RandTrain.
* The difference in accuracy between PathL and RandTrain is approximately 6.103 (44.864 - 38.761).
### Interpretation
The bar chart demonstrates that the PathL method achieves a significantly higher overall accuracy than the RandTrain method. This suggests that PathL is a more effective approach for the task being evaluated. The difference in accuracy is substantial, indicating a potentially significant advantage of using PathL over RandTrain.