## Bar Chart: Comparison of Overall Accuracy for PathL and RandTrain
### Overview
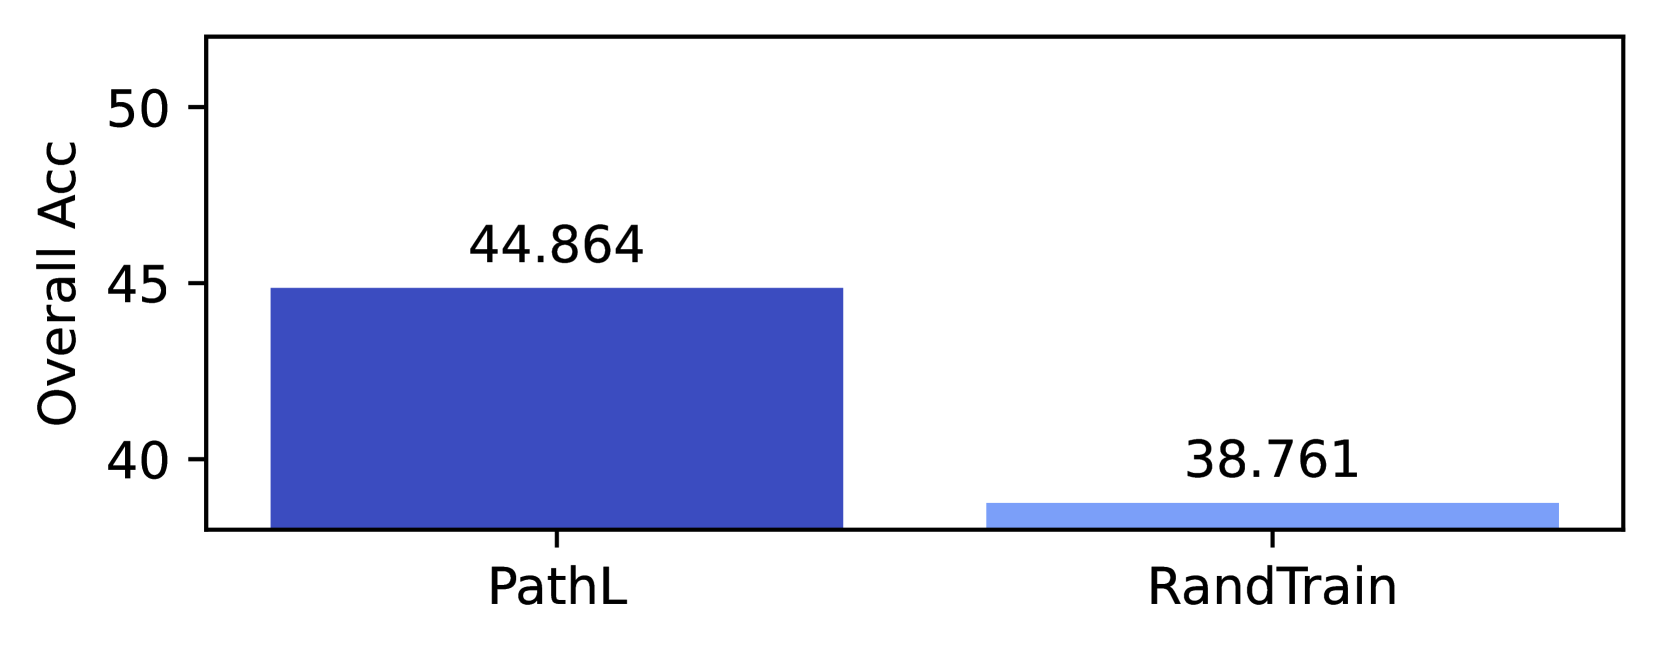
The image is a bar chart comparing the overall accuracy of two methods: **PathL** and **RandTrain**. The y-axis represents "Overall Acc" (accuracy) on a scale from 40 to 50, while the x-axis lists the two methods. Two bars are present, one for each method, with distinct colors (dark blue for PathL and light blue for RandTrain). Numerical values are explicitly labeled above each bar.
---
### Components/Axes
- **X-axis (Categories)**:
- Labels: "PathL" (left) and "RandTrain" (right).
- Positioning: Centered below each bar.
- **Y-axis (Values)**:
- Label: "Overall Acc" (vertical axis).
- Scale: Ranges from 40 to 50 in increments of 5.
- Positioning: Left side of the chart.
- **Legend**:
- Not explicitly present in the image. However, the distinct colors (dark blue for PathL, light blue for RandTrain) serve as implicit visual differentiation.
- **Data Labels**:
- "44.864" above the PathL bar.
- "38.761" above the RandTrain bar.
---
### Detailed Analysis
- **PathL**:
- Bar color: Dark blue.
- Value: 44.864 (highest accuracy).
- Position: Leftmost bar on the x-axis.
- **RandTrain**:
- Bar color: Light blue.
- Value: 38.761 (lower accuracy).
- Position: Rightmost bar on the x-axis.
---
### Key Observations
1. **Accuracy Disparity**: PathL achieves significantly higher overall accuracy (44.864) compared to RandTrain (38.761), a difference of approximately 6.103.
2. **Color Coding**: The use of distinct colors (dark blue vs. light blue) effectively distinguishes the two methods without a formal legend.
3. **Precision**: Numerical values are provided with three decimal places, suggesting a focus on granular performance metrics.
---
### Interpretation
The chart demonstrates that **PathL outperforms RandTrain** in terms of overall accuracy, indicating that PathL may be a more effective or optimized method for the task being measured. The absence of a legend implies that the color coding is self-explanatory, relying on visual contrast to convey the distinction between the two methods. The precise numerical values suggest a controlled experiment or benchmarking scenario, where even small differences in accuracy are critical. The disparity highlights the potential advantages of PathL over RandTrain, though further context (e.g., sample size, error margins) would be needed to assess statistical significance.