# Technical Document Extraction: Probability Distribution Bar Chart
## 1. Component Isolation
* **Header:** None present.
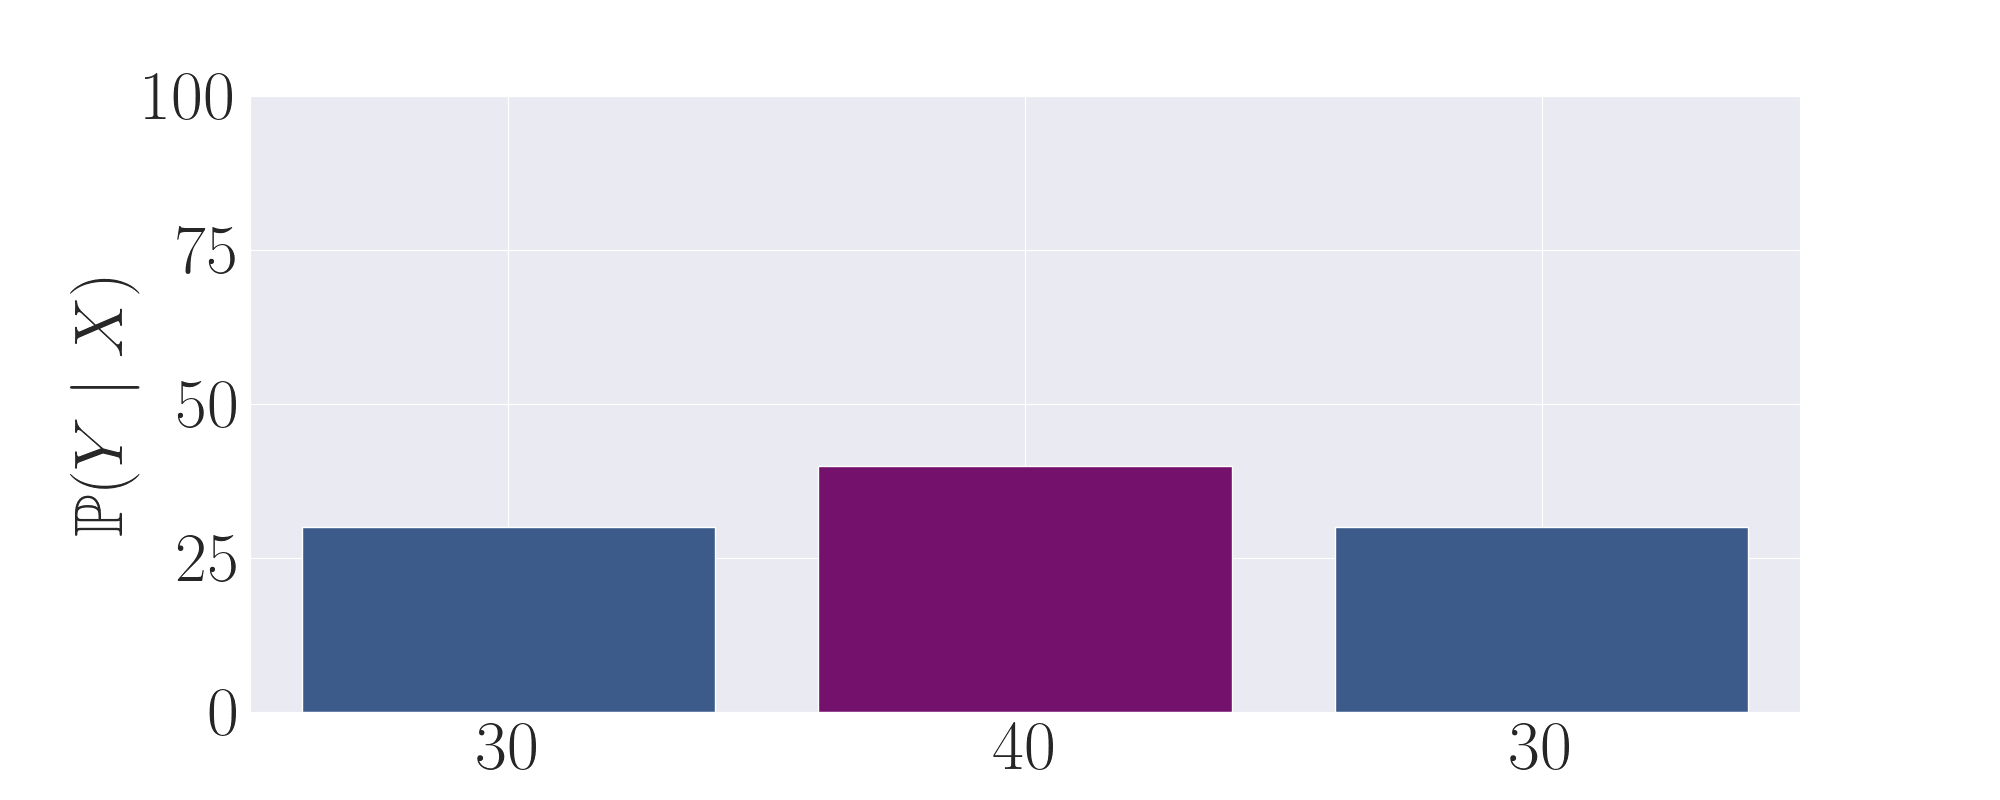
* **Main Chart Area:** A bar chart with three distinct bars plotted against a light gray grid background.
* **Y-Axis (Left):** Vertical axis representing a probability or percentage scale.
* **X-Axis (Bottom):** Horizontal axis containing numerical labels for each bar.
## 2. Axis and Label Extraction
* **Y-Axis Title:** $\mathbb{P}(Y \mid X)$ (Mathematical notation for the conditional probability of Y given X).
* **Y-Axis Markers:** 0, 25, 50, 75, 100.
* **X-Axis Labels:** 30, 40, 30 (Note: These labels correspond to the values/heights of the bars).
## 3. Data Table Reconstruction
The chart visualizes three categorical data points. The height of each bar corresponds exactly to the numerical label placed directly beneath it on the x-axis.
| Bar Position | Color | Label (Value) | Estimated Y-Axis Height |
| :--- | :--- | :--- | :--- |
| Left | Dark Blue/Slate | 30 | 30 |
| Center | Purple/Magenta | 40 | 40 |
| Right | Dark Blue/Slate | 30 | 30 |
## 4. Trend and Visual Analysis
* **Symmetry:** The chart displays a symmetrical "bell-like" distribution pattern. The outer two bars are identical in height and color, while the center bar is taller and a different color.
* **Color Coding:**
* The bars representing the value **30** are colored in a dark blue/slate shade.
* The bar representing the value **40** is colored in a deep purple/magenta shade.
* **Visual Trend:** The data follows a "Low-High-Low" sequence. Starting from the left, the value rises from 30 to 40 (a 33.3% increase) and then returns to 30.
* **Total Sum:** The sum of the values shown (30 + 40 + 30) equals **100**, which is consistent with the Y-axis scale representing a full probability distribution (100%).
## 5. Technical Description
This image is a bar chart representing a discrete conditional probability distribution $\mathbb{P}(Y \mid X)$. The vertical axis ranges from 0 to 100. The chart contains three bars. The first and third bars have a value of 30 and are colored dark blue. The middle bar has a value of 40 and is colored purple. The total area/value of the bars sums to 100, indicating these are likely percentage-based probabilities for three possible outcomes of $Y$ given a specific $X$. The background features a light gray grid with white grid lines aligned with the Y-axis markers at intervals of 25.