# Technical Document Extraction: Bar Chart Analysis
## Chart Overview
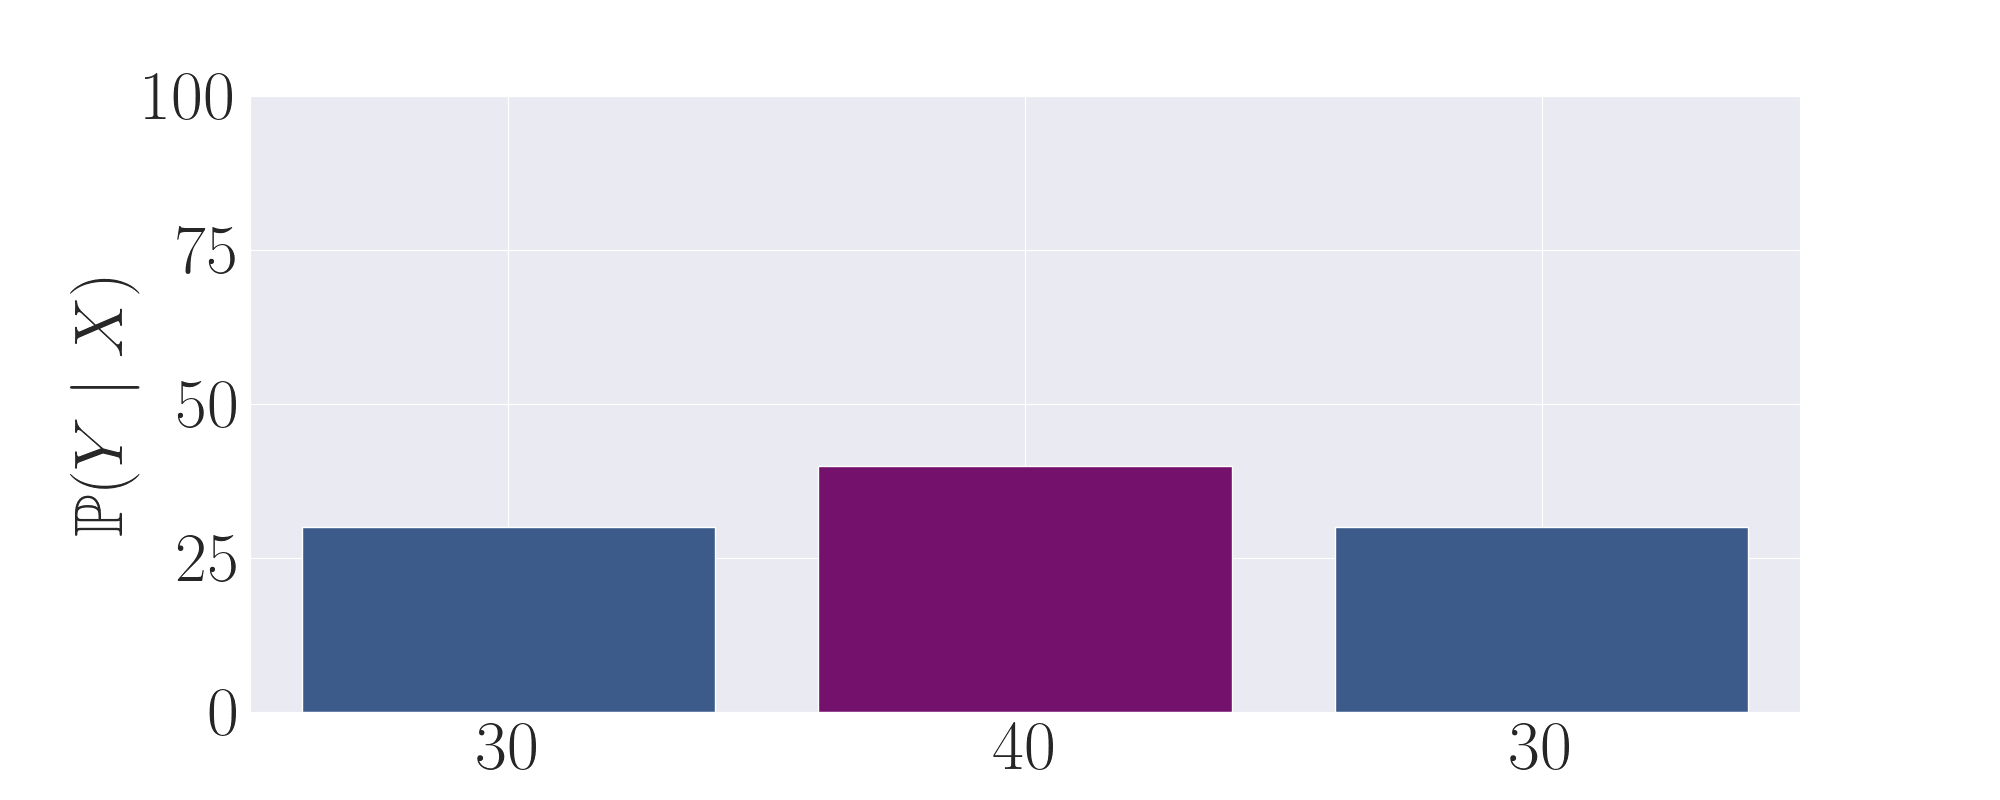
The image depicts a **bar chart** with three vertical bars representing probabilistic values. The chart lacks a legend, but color coding is used to differentiate data series.
---
### Axis Labels and Markers
- **Y-Axis**:
- Title: `ℙ(Y | X)` (probability of Y given X)
- Range: 0 to 100 (in increments of 25)
- Units: Probability (unitless)
- **X-Axis**:
- Categories: `30`, `40`, `30` (no explicit labels beyond numerical values)
- Position: Bottom of chart
---
### Data Series and Bars
1. **First Bar**
- **X Position**: 30
- **Y Value**: ~30 (height reaches 30 on Y-axis)
- **Color**: Blue
2. **Second Bar**
- **X Position**: 40
- **Y Value**: ~40 (height reaches 40 on Y-axis)
- **Color**: Purple
3. **Third Bar**
- **X Position**: 30
- **Y Value**: ~30 (height reaches 30 on Y-axis)
- **Color**: Blue
---
### Trends and Observations
- **Trend Verification**:
- The middle bar (X=40) exhibits the highest probability (~40), while the first and third bars (X=30) share identical lower probabilities (~30).
- No upward/downward slope observed (static bars).
- **Color Consistency**:
- Blue corresponds to X=30 (first and third bars).
- Purple corresponds to X=40 (second bar).
- No legend present to confirm color mappings; inferred from bar placement.
---
### Spatial Grounding
- **Legend**: Not present in the image.
- **Bar Placement**:
- X=30: Left and right edges of chart.
- X=40: Center of chart.
---
### Component Isolation
1. **Header**: No header text or title.
2. **Main Chart**:
- Three bars with distinct colors and positions.
- Gridlines visible (horizontal at Y=25, 50, 75, 100; vertical at X=30, 40).
3. **Footer**: No footer text or annotations.
---
### Data Table Reconstruction
| X Value | Y Value | Color |
|---------|---------|--------|
| 30 | 30 | Blue |
| 40 | 40 | Purple |
| 30 | 30 | Blue |
---
### Notes
- The chart lacks explicit textual annotations beyond axis labels.
- No embedded text or diagrams beyond the bars and gridlines.
- Probability values are inferred from bar heights relative to the Y-axis scale.