## Diagram: System Transformation Flowchart
### Overview
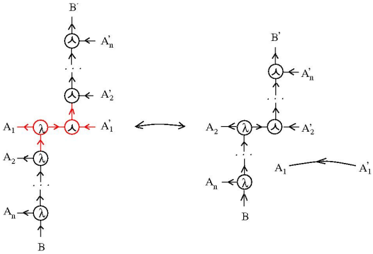
The image depicts a two-part diagram connected by a bidirectional arrow, illustrating a transformation process between two system states. The left diagram shows a complex network with feedback loops, while the right diagram presents a simplified linear structure.
### Components/Axes
**Left Diagram (Input State):**
- **Nodes:**
- `A₁`, `A₂`, ..., `Aₙ` (input nodes, labeled sequentially)
- `B` (central node)
- `B'` (output node)
- **Connections:**
- Red arrows indicate feedback loops:
- `A₁ ↔ A₁'`
- `A₂ ↔ A₂'`
- `B ↔ B'`
- Black arrows show unidirectional flow:
- `A₁ → A₂ → ... → Aₙ → B`
- **Highlight:** A red circle emphasizes the `A₁ ↔ A₁'` feedback loop.
**Right Diagram (Output State):**
- **Nodes:**
- `A₁'`, `A₂'`, ..., `Aₙ'` (transformed input nodes)
- `B'` (output node)
- **Connections:**
- Black arrows show a linear chain:
- `A₁' → A₂' → ... → Aₙ' → B'`
**Connecting Arrow:**
- A bidirectional arrow links the two diagrams, suggesting a reversible transformation.
### Detailed Analysis
1. **Left Diagram Structure:**
- The input state (`A₁` to `Aₙ`) feeds into `B`, which outputs to `B'`.
- Feedback loops (`A₁ ↔ A₁'`, `A₂ ↔ A₂'`, `B ↔ B'`) imply iterative adjustments or error correction.
- The red circle around `A₁ ↔ A₁'` suggests this loop is a focal point for analysis.
2. **Right Diagram Structure:**
- The output state (`A₁'` to `Aₙ'`) flows linearly into `B'`, with no feedback.
- Simplification from the left diagram’s complexity indicates a streamlined process.
3. **Bidirectional Arrow:**
- Implies the transformation between states is reversible, though the right diagram’s lack of feedback loops may limit reversibility in practice.
### Key Observations
- **Feedback Dominance:** The left diagram’s feedback loops (highlighted in red) contrast with the right diagram’s linearity, suggesting feedback is critical in the input state but absent in the output.
- **Node Reduction:** The right diagram omits `B` and `B'`, focusing only on transformed `A'` nodes and `B'`.
- **Unidirectional Flow:** The right diagram’s black arrows enforce a strict sequence, unlike the left diagram’s bidirectional feedback.
### Interpretation
This diagram likely represents a system optimization or abstraction process:
1. **Input State (Left):** A complex, feedback-driven system where components (`A₁`–`Aₙ`, `B`) interact iteratively to produce `B'`.
2. **Output State (Right):** A simplified, linearized version of the system, possibly after optimization or error correction. The removal of feedback loops (`A₁'`–`Aₙ'` to `B'`) suggests a focus on efficiency or stability.
3. **Bidirectional Arrow:** While the transformation is theoretically reversible, the right diagram’s lack of feedback may make practical reversibility challenging.
The red circle around `A₁ ↔ A₁'` highlights a critical interaction point, possibly indicating a bottleneck or key variable in the system’s behavior. The absence of numerical data prevents quantitative analysis, but the structural contrast emphasizes trade-offs between complexity and simplicity in system design.