\n
## Diagram: Math Concepts Map
### Overview
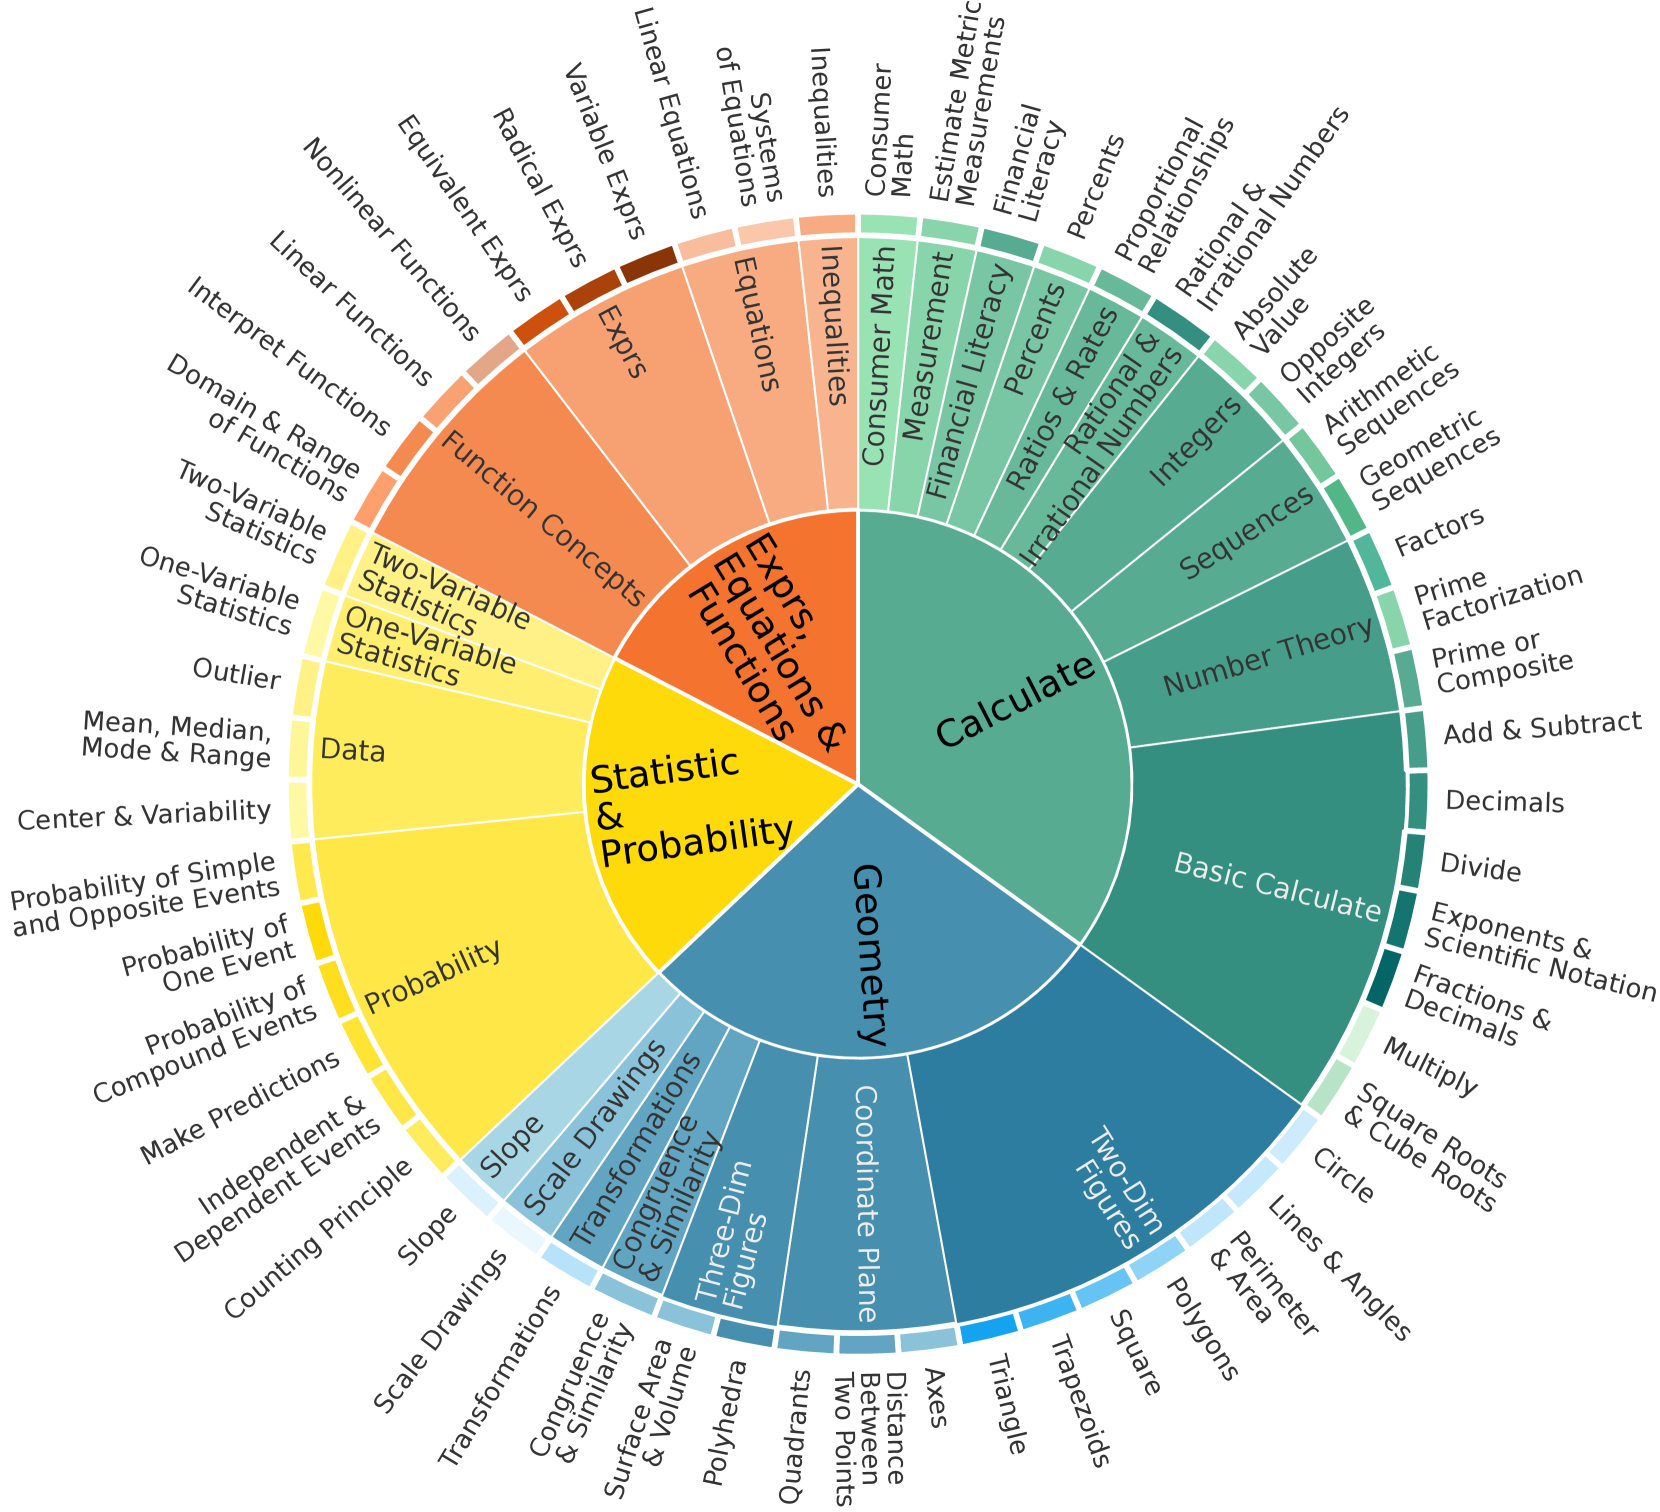
The image is a diagram representing a mind map or concept map of various mathematical topics. It's structured around a central node labeled "Exprs, Equations & Functions" with branches radiating outwards, categorizing different areas of mathematics. The diagram uses a radial layout, with topics becoming more specific as they move further from the center.
### Components/Axes
The diagram consists of the following main branches/categories:
* **Exprs (Expressions)**: Includes topics like Nonlinear Expressions, Radical Expressions, Variable Equations, Linear Equations, Equivalent Equations, and Systems of Equations.
* **Equations**: Includes topics like Consumer Math, Measurement Math, Estimate Metric Measurements, Financial Literacy, Percents, Proportional Relationships, Rational & Irrational Numbers, Absolute Value, Integers, Arithmetic Sequences, Geometric Sequences, Factors, Prime Factorization, Prime or Composite.
* **Functions**: Includes topics like Function Concepts, Interpret Functions, Domain & Range of Functions, Two-Variable Statistics, One-Variable Statistics, Outlier, Mean, Median, Mode & Range, Data, Center & Variability.
* **Calculate**: Includes topics like Number Theory, Sequences, Basic Calculate, Add & Subtract, Decimals, Divide, Exponents & Scientific Notation, Fractions & Decimals, Multiply, Square Roots & Cube Roots.
* **Geometry**: Includes topics like Probability, Statistic & Probability, Probability of Simple and Opposite Events, Probability of One Event, Probability of Events, Compound Events, Make Predictions, Independent & Dependent Events, Counting Principle, Slope, Scale Drawings, Transformations, Congruence & Similarity, Three-Dim Figures, Coordinate Plane Geometry, Quadrants, Distance Between Two Points, Triangle, Axes, Polyhedra, Square, Trapezoids, Two-Dim Figures, Perimeter & Angles, Circle, Lines & Area.
### Detailed Analysis or Content Details
The diagram is a visual organization of mathematical concepts, not a quantitative chart. It doesn't contain numerical data. Instead, it presents a hierarchical structure of topics.
* **Central Node:** "Exprs, Equations & Functions" is positioned at the center of the diagram.
* **First Level Branches:** The five main branches (Exprs, Equations, Functions, Calculate, Geometry) radiate outwards from the central node.
* **Second Level Branches:** Each main branch further divides into more specific subtopics. For example, under "Exprs," we find "Nonlinear Expressions," "Radical Expressions," etc.
* **Third Level Branches:** Some branches extend to a third level of specificity. For example, under "Geometry" we find "Triangle", "Axes", "Polyhedra", "Square", "Trapezoids", "Two-Dim Figures", "Perimeter & Angles", "Circle", "Lines & Area".
* **Branching Pattern:** The diagram uses a consistent branching pattern, with topics becoming increasingly specific as you move away from the center.
### Key Observations
* The diagram provides a broad overview of mathematical concepts, covering algebra, statistics, geometry, and basic arithmetic.
* The arrangement suggests relationships between different areas of mathematics. For example, "Functions" is closely linked to "Statistics" and "Data."
* The diagram is visually appealing and easy to understand, making it a useful tool for students or anyone looking to grasp the overall structure of mathematics.
* The diagram does not indicate the difficulty level or prerequisites for each topic.
### Interpretation
The diagram serves as a conceptual map of mathematics, illustrating the interconnectedness of various topics. It's a high-level overview, designed to provide a sense of the scope and structure of the subject. The central node, "Exprs, Equations & Functions," suggests that these concepts are fundamental to many areas of mathematics. The branching structure implies a hierarchical relationship, with more general topics branching out into more specific ones. The diagram could be used as a study aid, a curriculum guide, or a visual representation of the mathematical landscape. It's a qualitative representation of knowledge, rather than a quantitative one. The diagram doesn't offer any insights into the relative importance of different topics or the difficulty of learning them. It simply presents a structured overview of the subject matter.