## Diagram: Mathematics Curriculum Sunburst Chart
### Overview
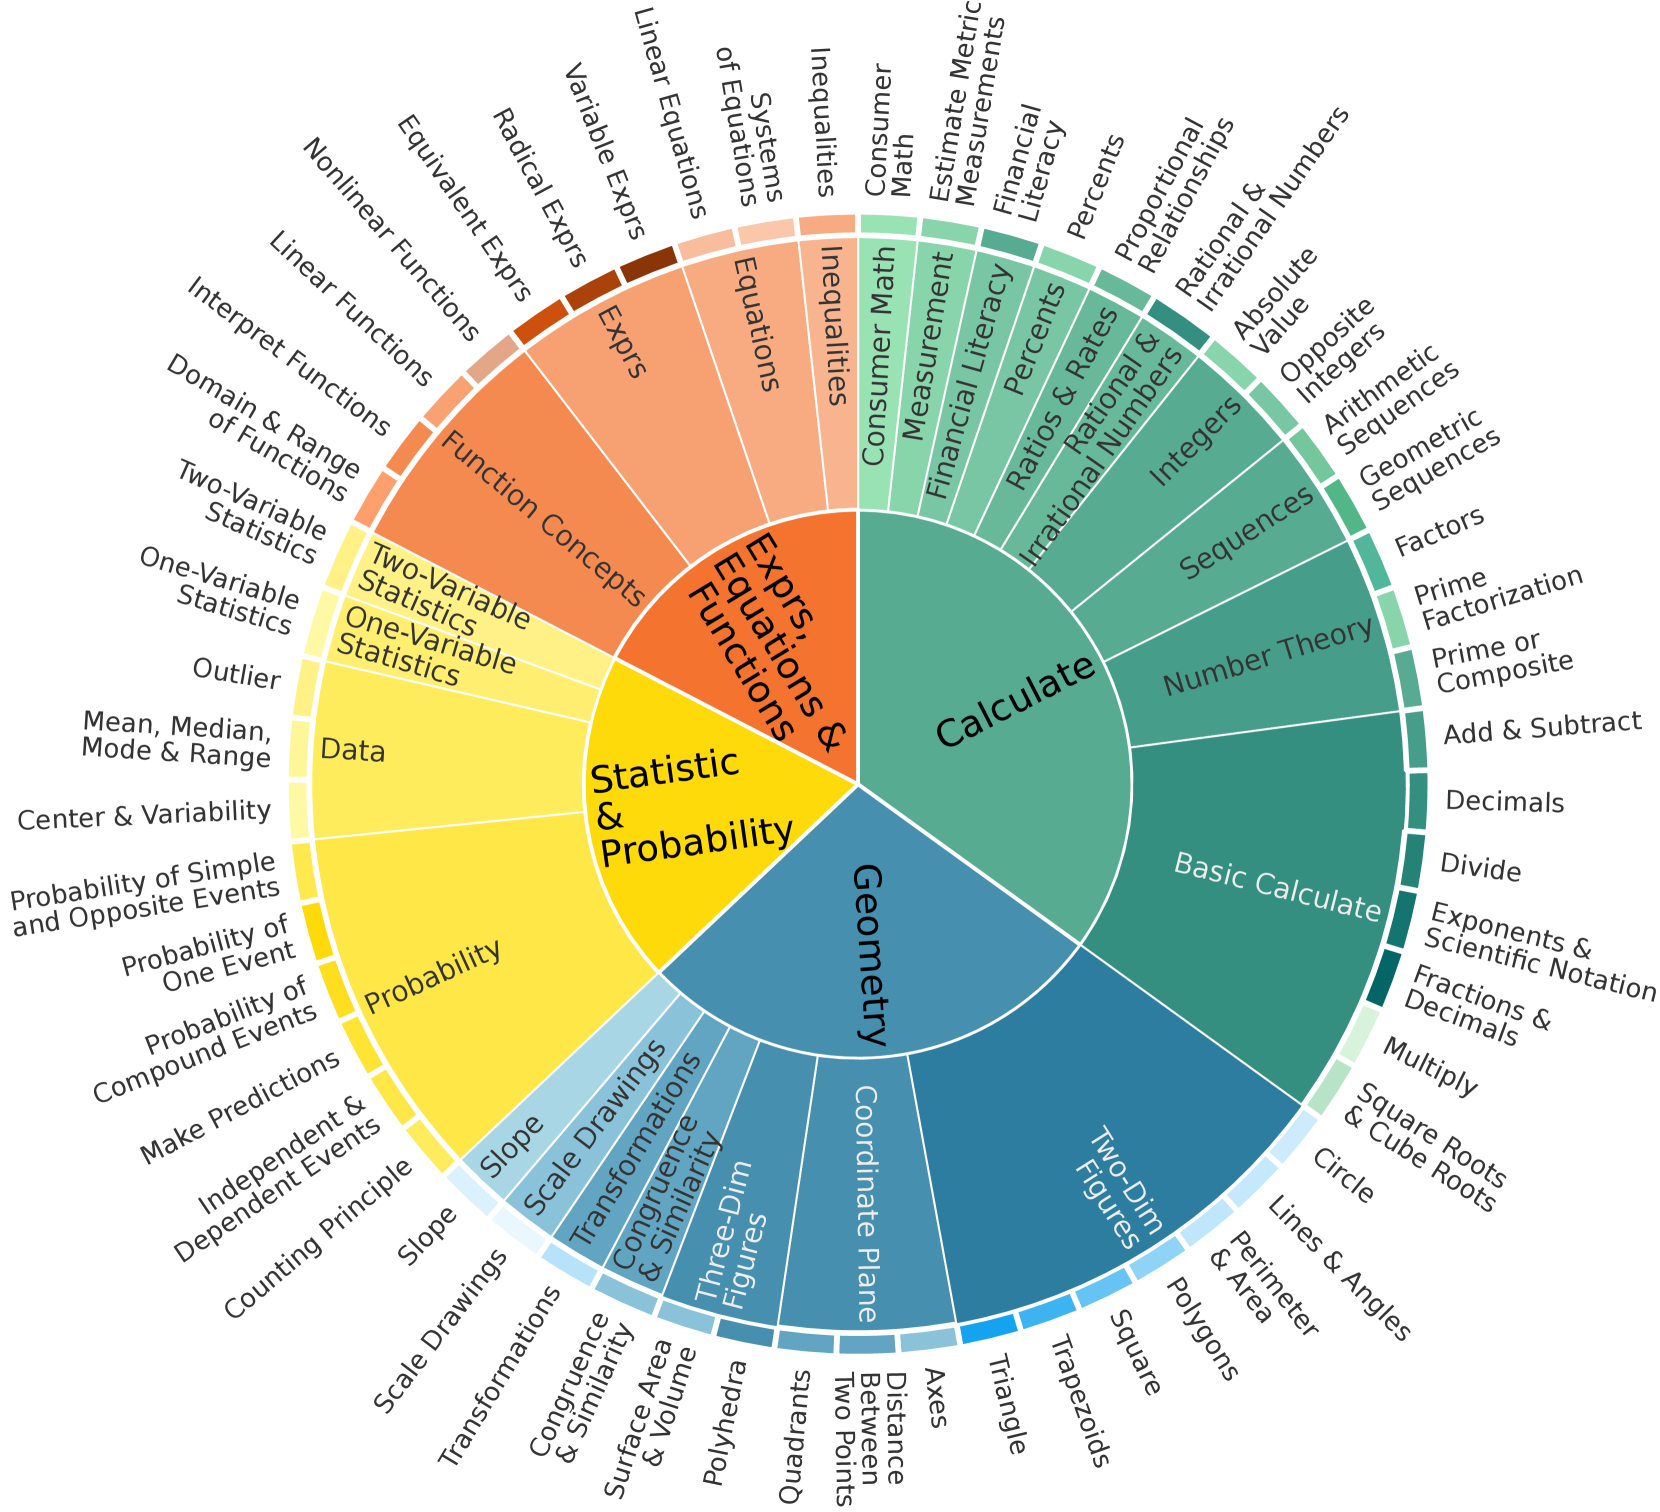
The image displays a multi-level sunburst chart (a radial hierarchical diagram) that organizes mathematical topics into a structured curriculum. The chart is divided into four primary color-coded categories, each branching into subcategories and specific topics. The design is informational, intended to show the relationships and hierarchy within a mathematics learning framework. All text is in English.
### Components/Axes
The diagram has no traditional axes. It is composed of concentric rings divided into colored segments. The hierarchy flows from the center outward:
- **Innermost Ring (Core Categories):** Four main domains.
- **Middle Ring (Subcategories):** Major topic areas within each domain.
- **Outer Ring (Specific Topics):** Granular skills and concepts.
**Legend/Color Key (Integrated into the chart):**
- **Green (Teal):** Calculate
- **Blue:** Geometry
- **Yellow:** Statistic & Probability
- **Orange:** Exprs, Equations & Functions
### Detailed Analysis
The chart is segmented into four quadrants, each representing a core mathematical domain. Below is a complete transcription of all text, organized by quadrant and hierarchical level.
#### **1. Calculate (Green/Teal Quadrant - Top Right)**
* **Core Category:** Calculate
* **Subcategories & Specific Topics:**
* **Basic Calculate**
* Add & Subtract
* Decimals
* Divide
* Exponents & Scientific Notation
* Fractions & Decimals
* Multiply
* Square Roots & Cube Roots
* **Number Theory**
* Factors
* Prime Factorization
* Prime or Composite
* **Sequences**
* Arithmetic Sequences
* Geometric Sequences
* **Integers**
* Opposite Integers
* Absolute Value
* **Rational & Irrational Numbers**
* **Ratios & Rates**
* **Percents**
* **Financial Literacy**
* **Measurement**
* Estimate Metric Measurements
* **Consumer Math**
#### **2. Geometry (Blue Quadrant - Bottom Right)**
* **Core Category:** Geometry
* **Subcategories & Specific Topics:**
* **Two-Dim Figures**
* Polygons
* Perimeter & Area
* Lines & Angles
* Circle
* Square
* Trapezoids
* Triangle
* **Coordinate Plane**
* Axes
* Distance Between Two Points
* Quadrants
* **Three-Dim Figures**
* Polyhedra
* Surface Area & Volume
* **Congruence & Similarity**
* **Transformations**
* **Scale Drawings**
* **Slope**
#### **3. Statistic & Probability (Yellow Quadrant - Bottom Left)**
* **Core Category:** Statistic & Probability
* **Subcategories & Specific Topics:**
* **Data**
* One-Variable Statistics
* Two-Variable Statistics
* Outlier
* Mean, Median, Mode & Range
* Center & Variability
* **Probability**
* Probability of Simple and Opposite Events
* Probability of One Event
* Probability of Compound Events
* Make Predictions
* Independent & Dependent Events
* Counting Principle
#### **4. Exprs, Equations & Functions (Orange Quadrant - Top Left)**
* **Core Category:** Exprs, Equations & Functions
* **Subcategories & Specific Topics:**
* **Function Concepts**
* Interpret Functions
* Domain & Range of Functions
* Linear Functions
* Nonlinear Functions
* **Exprs**
* Equivalent Exprs
* Radical Exprs
* Variable Exprs
* **Equations**
* Linear Equations
* Systems of Equations
* **Inequalities**
### Key Observations
1. **Hierarchical Structure:** The diagram clearly shows a three-tiered hierarchy: Core Domain -> Major Topic Area -> Specific Skill/Concept.
2. **Topic Density:** The "Calculate" and "Geometry" domains appear to contain the highest number of discrete, specific topics in the outer ring.
3. **Conceptual Grouping:** Related concepts are clustered together. For example, all basic arithmetic operations are under "Basic Calculate," and all shape-related topics are under "Two-Dim Figures."
4. **Visual Organization:** The use of color and radial segmentation effectively isolates each major domain while showing they are part of a unified whole (the complete mathematics curriculum).
### Interpretation
This diagram serves as a comprehensive visual taxonomy of a mathematics curriculum, likely for middle school or early high school level. It demonstrates how broad mathematical disciplines (Calculation, Geometry, Statistics/Probability, Algebra) are broken down into teachable and assessable components.
The structure suggests a pedagogical approach that values both foundational skills (e.g., "Add & Subtract," "Multiply") and higher-order conceptual understanding (e.g., "Interpret Functions," "Make Predictions"). The inclusion of practical applications like "Financial Literacy" and "Consumer Math" indicates an emphasis on real-world relevance.
The radial, interconnected design implies that these domains are not isolated silos but are interrelated. For instance, "Slope" (under Geometry) is fundamentally connected to "Linear Functions" (under Exprs, Equations & Functions). The chart effectively communicates the breadth and depth of a standard mathematics education framework, making it a useful tool for curriculum planning, student guidance, or educational standards mapping.