## Directed Graph: State Transition Diagram
### Overview
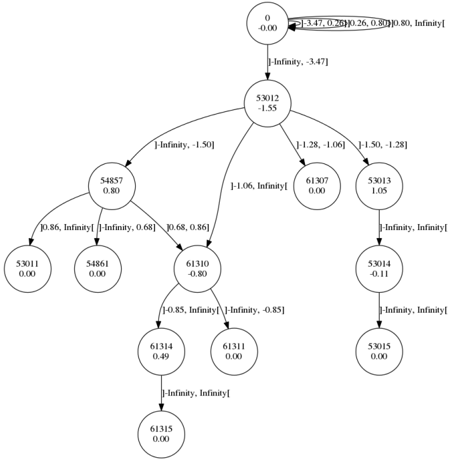
The image depicts a directed graph, likely representing a state transition diagram. Each node represents a state, labeled with a numerical identifier and a value. The edges between nodes represent transitions, with each edge labeled with an interval.
### Components/Axes
* **Nodes:** Represented as circles, each containing two lines of text:
* A numerical identifier (e.g., 0, 53012, 54857).
* A numerical value (e.g., -0.00, -1.55, 0.80).
* **Edges:** Represented as arrows, indicating the direction of the transition. Each edge is labeled with an interval, enclosed in square brackets (e.g., `[-3.47, 0.26]`, `[-Infinity, -3.47]`).
* **Root Node:** The node labeled "0" with a value of "-0.00" is at the top of the diagram.
### Detailed Analysis
Here's a breakdown of the nodes and their connections, including the interval labels on the edges:
* **Node 0:**
* Identifier: 0
* Value: -0.00
* Outgoing edge to itself: `[-3.47, 0.26]`, `[0.26, 0.80]`, `[0.80, Infinity]`
* Outgoing edge to Node 53012: `[-Infinity, -3.47]`
* **Node 53012:**
* Identifier: 53012
* Value: -1.55
* Outgoing edge to Node 54857: `[-Infinity, -1.50]`
* Outgoing edge to Node 61307: `[-1.28, -1.06]`
* Outgoing edge to Node 53013: `[-1.50, -1.28]`
* Outgoing edge to Node 61310: `[-1.06, Infinity]`
* **Node 54857:**
* Identifier: 54857
* Value: 0.80
* Outgoing edge to Node 53011: `[0.86, Infinity]`
* Outgoing edge to Node 54861: `[-Infinity, 0.68]`
* Outgoing edge to Node 61310: `[0.68, 0.86]`
* **Node 61307:**
* Identifier: 61307
* Value: 0.00
* No outgoing edges.
* **Node 53013:**
* Identifier: 53013
* Value: 1.05
* Outgoing edge to Node 53014: `[-Infinity, Infinity]`
* **Node 61310:**
* Identifier: 61310
* Value: -0.80
* Outgoing edge to Node 61314: `[-0.85, Infinity]`
* Outgoing edge to Node 61311: `[-Infinity, -0.85]`
* **Node 53011:**
* Identifier: 53011
* Value: 0.00
* No outgoing edges.
* **Node 54861:**
* Identifier: 54861
* Value: 0.00
* No outgoing edges.
* **Node 61314:**
* Identifier: 61314
* Value: 0.49
* Outgoing edge to Node 61315: `[-Infinity, Infinity]`
* **Node 61311:**
* Identifier: 61311
* Value: 0.00
* No outgoing edges.
* **Node 53014:**
* Identifier: 53014
* Value: -0.11
* Outgoing edge to Node 53015: `[-Infinity, Infinity]`
* **Node 61315:**
* Identifier: 61315
* Value: 0.00
* No outgoing edges.
* **Node 53015:**
* Identifier: 53015
* Value: 0.00
* No outgoing edges.
### Key Observations
* Node 0 is the root and has a self-loop.
* The edges are labeled with intervals, suggesting conditions or probabilities for the transitions.
* Several nodes (53011, 54861, 61307, 61311, 61315, 53015) are terminal nodes, having no outgoing edges.
* Some edges have intervals that include infinity, indicating unbounded conditions.
### Interpretation
The diagram likely represents a state machine or a decision tree. The numerical values associated with each node could represent a cost, a probability, or some other relevant metric for that state. The intervals on the edges define the conditions under which a transition from one state to another occurs. The self-loop on Node 0 suggests that the system can remain in the initial state under certain conditions. The terminal nodes represent final states or outcomes. The intervals on the edges could represent ranges of values for a variable that determines the transition. The use of infinity in some intervals suggests that the transition is possible for all values above or below a certain threshold.