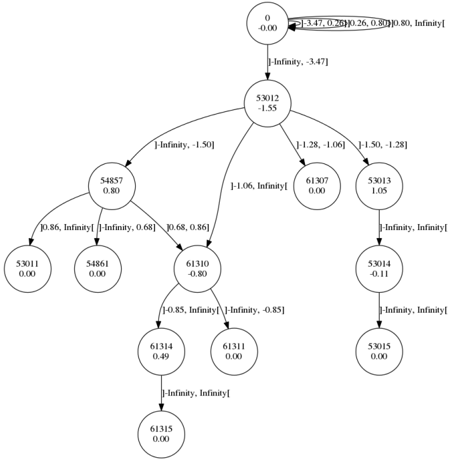
## Diagram: Hierarchical Tree with Interval-Labeled Edges
### Overview
The image displays a hierarchical tree diagram, likely representing a decision tree, state transition diagram, or a similar structured model. It consists of circular nodes connected by directed edges (arrows). Each node contains two numbers: an upper identifier (ID) and a lower value. Each directed edge is labeled with an interval, often involving `-Infinity` or `Infinity`, suggesting conditional branches or ranges.
### Components/Axes
* **Nodes:** Circular elements containing two lines of text.
* **Upper Line:** A node identifier (e.g., `0`, `53012`, `54857`).
* **Lower Line:** A numerical value, often a decimal (e.g., `-0.00`, `-1.55`, `0.80`).
* **Edges:** Directed arrows connecting nodes, indicating flow or relationship.
* **Edge Labels:** Text placed along the edges, formatted as intervals (e.g., `]-Infinity, -3.47]`, `[0.26, 0.80]`). These likely define the condition or range under which the transition occurs.
* **Spatial Layout:** The tree is rooted at the top and branches downward. The layout is asymmetrical, with varying branch lengths and node placements.
### Detailed Analysis
**Root Node (Top Center):**
* **ID:** `0`
* **Value:** `-0.00`
* **Outgoing Edge:** One edge labeled `]-Infinity, -3.47]` leading to node `53012`.
**First-Level Node (Center, below root):**
* **ID:** `53012`
* **Value:** `-1.55`
* **Outgoing Edges (4):**
1. **Left:** To node `54857`. Label: `]-Infinity, -1.50]`.
2. **Center-Left:** To node `61310`. Label: `]-1.06, Infinity[`.
3. **Center-Right:** To node `61307`. Label: `]-1.28, -1.06]`.
4. **Right:** To node `53013`. Label: `]-1.50, -1.28]`.
**Left Branch (from 53012):**
* **Node `54857` (Value: `0.80`):**
* **Outgoing Edges (3):**
1. **Left:** To node `53011` (Value: `0.00`). Label: `[0.86, Infinity[`.
2. **Center:** To node `54861` (Value: `0.00`). Label: `]-Infinity, 0.68]`.
3. **Right:** To node `61310` (Value: `-0.80`). Label: `[0.68, 0.86]`.
**Center Subtree (from 54857 and 53012):**
* **Node `61310` (Value: `-0.80`):** Receives edges from both `54857` and `53012`.
* **Outgoing Edges (2):**
1. **Left:** To node `61314` (Value: `0.49`). Label: `[0.85, Infinity[`.
2. **Right:** To node `61311` (Value: `0.00`). Label: `]-Infinity, -0.85]`.
* **Node `61314` (Value: `0.49`):**
* **Outgoing Edge (1):** To node `61315` (Value: `0.00`). Label: `]-Infinity, Infinity[`.
**Right Branch (from 53012):**
* **Node `61307` (Value: `0.00`):** A leaf node (no outgoing edges).
* **Node `53013` (Value: `1.05`):**
* **Outgoing Edge (1):** To node `53014` (Value: `-0.11`). Label: `]-Infinity, Infinity[`.
* **Node `53014` (Value: `-0.11`):**
* **Outgoing Edge (1):** To node `53015` (Value: `0.00`). Label: `]-Infinity, Infinity[`.
* **Node `53015` (Value: `0.00`):** A leaf node.
**Leaf Nodes (Value: `0.00`):** `53011`, `54861`, `61307`, `61311`, `61315`, `53015`.
### Key Observations
1. **Node Value Pattern:** Leaf nodes consistently have a value of `0.00`. Internal nodes have non-zero values, both positive and negative.
2. **Interval Labels:** All edge labels are intervals. Some are closed on one side (`]a, b]` or `[a, b[`), and some are open on both sides (`]a, b[`). The use of `Infinity` and `-Infinity` indicates unbounded ranges.
3. **Convergence:** Node `61310` is a convergence point, receiving inputs from two different parent nodes (`54857` and `53012`).
4. **Asymmetry:** The tree is not balanced. The left side (from `54857`) has more branching depth than the right side.
5. **Value Flow:** There is no simple monotonic trend (e.g., always increasing or decreasing) in the node values from root to leaves. Values fluctuate (e.g., `-1.55` -> `0.80` -> `-0.80` -> `0.49`).
### Interpretation
This diagram most likely represents a **trained decision tree model** or a **state-transition system with conditional branches**.
* **What it Suggests:** Each node represents a decision point or a state. The upper number is likely a unique feature or state ID. The lower number could be a prediction value, a state score, or a bias term. The edge labels define the splitting criteria: a feature value falling within the specified interval triggers that branch.
* **How Elements Relate:** The root node makes the first split. Subsequent nodes refine the decision or transition based on further conditions. The convergence at node `61310` indicates that different initial conditions can lead to the same intermediate state or decision path.
* **Notable Patterns/Anomalies:**
* The prevalence of `0.00` at leaf nodes suggests these are terminal states, possibly representing a default outcome, a neutral classification, or an end condition.
* The intervals are not uniformly formatted (some use `]`, some use `[`), which is critical for precise interpretation of the splitting logic.
* The path from root to node `61314` involves three splits with conditions on different features (implied by the different node IDs), culminating in a positive value (`0.49`), which might indicate a specific, non-default outcome.
**In essence, the diagram maps a complex, non-linear decision process where outcomes (leaf nodes) are reached through a series of conditional checks on various parameters (node IDs), with the path taken determined by where a parameter's value falls within specific numerical ranges.**