## Decision Tree Diagram: Hierarchical Classification/Regression Model
### Overview
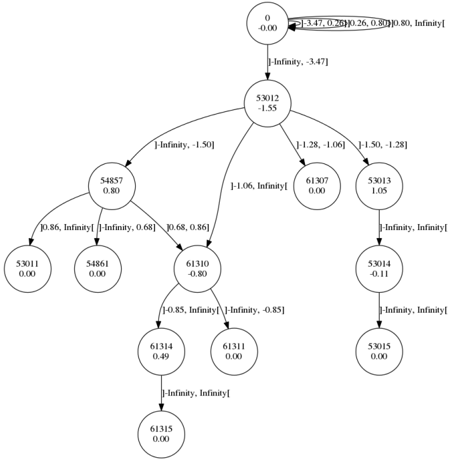
The image depicts a hierarchical decision tree structure with numerical nodes and directional arrows. The tree originates from a root node labeled "0.00" and branches into multiple paths with numerical values, thresholds, and "Infinity" labels. Arrows contain multi-value annotations (e.g., "3.47, 0.20, 0.26, 0.80, Infinity"), suggesting conditional transitions between nodes.
### Components/Axes
- **Root Node**: "0.00" (top-center)
- **Legend**: Located at top-right, labeled "Infinity" with range values "-3.47, 0.20, 0.26, 0.80, Infinity"
- **Nodes**:
- Primary nodes: 53012, 54857, 53013, 61310, 53014, 53015, 53011, 54861, 61314, 61311, 61315
- Secondary nodes: 53010, 53015, 53014, 53011, 54861, 61314, 61311, 61315
- **Arrows**:
- Contain multi-value annotations (e.g., "3.47, 0.20, 0.26, 0.80, Infinity")
- Labels include "Infinity" with ranges (e.g., "Infinity, -1.50", "Infinity, -0.85")
### Detailed Analysis
1. **Root to First Branch**:
- Root "0.00" → Node "53012" via arrow labeled "3.47, 0.20, 0.26, 0.80, Infinity"
- Node "53012" branches into:
- "54857" (arrow: "Infinity, -1.50")
- "53013" (arrow: "1.28, -1.06")
- "61310" (arrow: "1.06, Infinity")
- "53014" (arrow: "Infinity, Infinity")
2. **Subsequent Branches**:
- **54857** → "53011" (arrow: "10.86, Infinity") and "54861" (arrow: "Infinity, 0.68")
- **61310** → "61314" (arrow: "10.85, Infinity") and "61311" (arrow: "-0.80, -0.85")
- **61314** → "61315" (arrow: "Infinity, Infinity")
- **53014** → "53015" (arrow: "Infinity, Infinity")
3. **Terminal Nodes**:
- Nodes like "53015", "53014", "53011", "54861", "61315" have no outgoing arrows, suggesting final decision points.
### Key Observations
- **Thresholds and Infinity**: Multiple arrows use "Infinity" as a boundary condition, likely indicating outlier handling or unbounded ranges.
- **Multi-Value Arrows**: Arrows contain 4-5 numerical values, possibly representing feature thresholds, weights, or confidence intervals.
- **Hierarchical Structure**: The tree has 3-4 layers of branching, with nodes splitting into 2-4 child nodes.
- **Negative Values**: Some arrows include negative values (e.g., "-1.50", "-0.85"), suggesting directional or comparative metrics.
### Interpretation
This diagram likely represents a **machine learning decision tree** or **optimization model** with:
1. **Conditional Splits**: Nodes split based on feature thresholds (e.g., "53012" → "54857" if value exceeds 3.47).
2. **Infinity Handling**: "Infinity" labels may denote:
- Unbounded ranges for continuous variables
- Outlier thresholds (e.g., "Infinity, -1.50" could mean values > -1.50 are treated as infinity)
3. **Multi-Value Arrows**: The 4-5 values per arrow might represent:
- Feature importance scores
- Confidence intervals for splits
- Probability distributions
4. **Terminal Nodes**: Final nodes (e.g., "53015") likely represent class labels or predicted values.
The structure suggests a complex model with nested decision boundaries, where each split refines predictions based on feature interactions. The use of "Infinity" indicates the model accounts for extreme values, possibly in regression tasks or anomaly detection.