## Bar Charts: Throughput vs. Packet Delays
### Overview
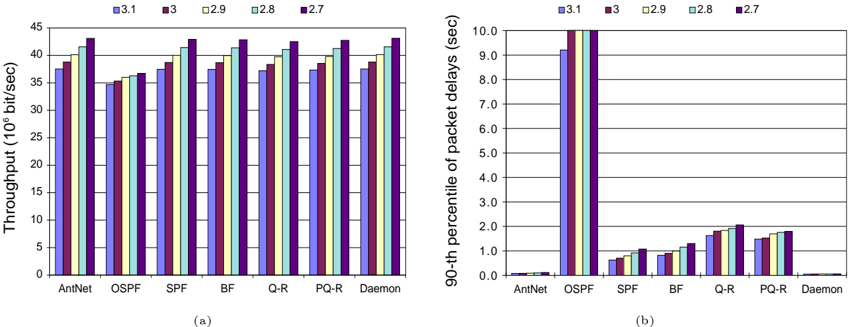
The image presents two bar charts comparing the throughput and packet delays of different network protocols. The left chart (a) displays the throughput in millions of bits per second, while the right chart (b) shows the 90th percentile of packet delays in seconds. Both charts compare the performance of AntNet, OSPF, SPF, BF, Q-R, PQ-R, and Daemon protocols under varying conditions represented by different colored bars (3.1, 3, 2.9, 2.8, and 2.7).
### Components/Axes
**Chart (a): Throughput**
* **Y-axis:** Throughput (10^6 bit/sec), with a scale from 0 to 45 in increments of 5.
* **X-axis:** Network protocols: AntNet, OSPF, SPF, BF, Q-R, PQ-R, Daemon.
* **Legend (Top):**
* Blue: 3.1
* Purple: 3
* Yellow: 2.9
* Light Blue: 2.8
* Dark Purple: 2.7
**Chart (b): Packet Delays**
* **Y-axis:** 90-th percentile of packet delays (sec), with a scale from 0.0 to 10.0 in increments of 1.0.
* **X-axis:** Network protocols: AntNet, OSPF, SPF, BF, Q-R, PQ-R, Daemon.
* **Legend (Top):**
* Blue: 3.1
* Purple: 3
* Yellow: 2.9
* Light Blue: 2.8
* Dark Purple: 2.7
### Detailed Analysis
**Chart (a): Throughput**
* **AntNet:** Throughput ranges from approximately 37 (2.7) to 42 (3.1) x 10^6 bit/sec.
* **OSPF:** Throughput ranges from approximately 35 (2.7) to 43 (3.1) x 10^6 bit/sec.
* **SPF:** Throughput ranges from approximately 36 (2.7) to 42 (3.1) x 10^6 bit/sec.
* **BF:** Throughput ranges from approximately 37 (2.7) to 42 (3.1) x 10^6 bit/sec.
* **Q-R:** Throughput ranges from approximately 38 (2.7) to 43 (3.1) x 10^6 bit/sec.
* **PQ-R:** Throughput ranges from approximately 37 (2.7) to 42 (3.1) x 10^6 bit/sec.
* **Daemon:** Throughput ranges from approximately 38 (2.7) to 42 (3.1) x 10^6 bit/sec.
*Trend:* For all protocols, the throughput generally increases from condition 2.7 to 3.1.
**Chart (b): Packet Delays**
* **AntNet:** Packet delays are very low, approximately 0.1 sec across all conditions.
* **OSPF:** Packet delays are very high, approximately 9.2 (2.7) to 9.9 (3.1) sec.
* **SPF:** Packet delays range from approximately 0.7 (2.7) to 1.0 (3.1) sec.
* **BF:** Packet delays range from approximately 0.8 (2.7) to 1.1 (3.1) sec.
* **Q-R:** Packet delays range from approximately 1.6 (2.7) to 2.0 (3.1) sec.
* **PQ-R:** Packet delays range from approximately 1.5 (2.7) to 1.8 (3.1) sec.
* **Daemon:** Packet delays are very low, approximately 0.1 sec across all conditions.
*Trend:* For most protocols (excluding AntNet and Daemon), the packet delays increase from condition 2.7 to 3.1. OSPF has significantly higher packet delays compared to other protocols.
### Key Observations
* OSPF has the highest packet delays, significantly higher than other protocols.
* AntNet and Daemon have very low packet delays.
* Throughput is relatively similar across all protocols, with a slight increase from condition 2.7 to 3.1.
* Packet delays generally increase from condition 2.7 to 3.1 for SPF, BF, Q-R, and PQ-R.
### Interpretation
The data suggests that OSPF, while having a competitive throughput, suffers from significantly higher packet delays compared to other protocols. AntNet and Daemon offer very low packet delays, potentially at the cost of slightly lower throughput in some conditions. The conditions represented by 3.1 appear to generally result in higher throughput and packet delays compared to 2.7. The choice of protocol would depend on the specific requirements of the network, balancing the need for high throughput with the tolerance for packet delays.