\n
## Bar Charts: Throughput and 90th Percentile Packet Delays
### Overview
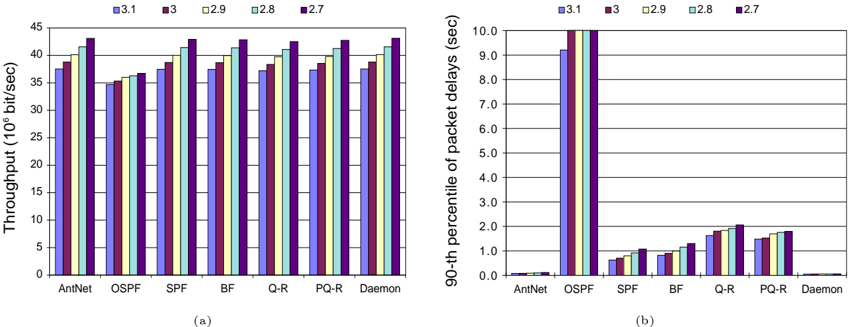
The image presents two bar charts side-by-side, labeled (a) and (b). Chart (a) displays throughput (in 10^6 bit/sec) for different network configurations (AntNet, OSPF, SPF, BF, Q-R, PQ-R, Daemon) under varying parameter settings (3.1, 3, 2.9, 2.8, 2.7). Chart (b) shows the 90th percentile of packet delays (in seconds) for the same network configurations and parameter settings.
### Components/Axes
**Chart (a): Throughput**
* **X-axis:** Network Configuration (AntNet, OSPF, SPF, BF, Q-R, PQ-R, Daemon)
* **Y-axis:** Throughput (10^6 bit/sec), ranging from 0 to 45.
* **Legend:**
* 3.1 (Dark Blue)
* 3 (Light Blue)
* 2.9 (Green)
* 2.8 (Purple)
* 2.7 (Pink)
**Chart (b): 90th Percentile Packet Delays**
* **X-axis:** Network Configuration (AntNet, OSPF, SPF, BF, Q-R, PQ-R, Daemon)
* **Y-axis:** 90th percentile of packet delays (sec), ranging from 0 to 10.
* **Legend:**
* 3.1 (Dark Blue)
* 3 (Light Blue)
* 2.9 (Green)
* 2.8 (Purple)
* 2.7 (Pink)
### Detailed Analysis or Content Details
**Chart (a): Throughput**
* **AntNet:**
* 3.1: Approximately 41.5 x 10^6 bit/sec
* 3: Approximately 39.5 x 10^6 bit/sec
* 2.9: Approximately 38.5 x 10^6 bit/sec
* 2.8: Approximately 39 x 10^6 bit/sec
* 2.7: Approximately 39 x 10^6 bit/sec
* **OSPF:**
* 3.1: Approximately 38 x 10^6 bit/sec
* 3: Approximately 36 x 10^6 bit/sec
* 2.9: Approximately 35 x 10^6 bit/sec
* 2.8: Approximately 35.5 x 10^6 bit/sec
* 2.7: Approximately 36 x 10^6 bit/sec
* **SPF:**
* 3.1: Approximately 41 x 10^6 bit/sec
* 3: Approximately 39 x 10^6 bit/sec
* 2.9: Approximately 38 x 10^6 bit/sec
* 2.8: Approximately 38.5 x 10^6 bit/sec
* 2.7: Approximately 39 x 10^6 bit/sec
* **BF:**
* 3.1: Approximately 42 x 10^6 bit/sec
* 3: Approximately 40 x 10^6 bit/sec
* 2.9: Approximately 39 x 10^6 bit/sec
* 2.8: Approximately 39.5 x 10^6 bit/sec
* 2.7: Approximately 40 x 10^6 bit/sec
* **Q-R:**
* 3.1: Approximately 40 x 10^6 bit/sec
* 3: Approximately 38 x 10^6 bit/sec
* 2.9: Approximately 37 x 10^6 bit/sec
* 2.8: Approximately 37.5 x 10^6 bit/sec
* 2.7: Approximately 38 x 10^6 bit/sec
* **PQ-R:**
* 3.1: Approximately 40.5 x 10^6 bit/sec
* 3: Approximately 38.5 x 10^6 bit/sec
* 2.9: Approximately 37.5 x 10^6 bit/sec
* 2.8: Approximately 38 x 10^6 bit/sec
* 2.7: Approximately 38.5 x 10^6 bit/sec
* **Daemon:**
* 3.1: Approximately 40 x 10^6 bit/sec
* 3: Approximately 38 x 10^6 bit/sec
* 2.9: Approximately 37 x 10^6 bit/sec
* 2.8: Approximately 37.5 x 10^6 bit/sec
* 2.7: Approximately 38 x 10^6 bit/sec
**Chart (b): 90th Percentile Packet Delays**
* **AntNet:**
* 3.1: Approximately 9.8 sec
* 3: Approximately 1.1 sec
* 2.9: Approximately 0.9 sec
* 2.8: Approximately 0.8 sec
* 2.7: Approximately 0.7 sec
* **OSPF:**
* 3.1: Approximately 10 sec
* 3: Approximately 1.2 sec
* 2.9: Approximately 1 sec
* 2.8: Approximately 0.9 sec
* 2.7: Approximately 0.8 sec
* **SPF:**
* 3.1: Approximately 9.5 sec
* 3: Approximately 1.1 sec
* 2.9: Approximately 0.9 sec
* 2.8: Approximately 0.8 sec
* 2.7: Approximately 0.7 sec
* **BF:**
* 3.1: Approximately 9.2 sec
* 3: Approximately 1.1 sec
* 2.9: Approximately 0.9 sec
* 2.8: Approximately 0.8 sec
* 2.7: Approximately 0.7 sec
* **Q-R:**
* 3.1: Approximately 8.5 sec
* 3: Approximately 1.3 sec
* 2.9: Approximately 1.1 sec
* 2.8: Approximately 0.9 sec
* 2.7: Approximately 0.8 sec
* **PQ-R:**
* 3.1: Approximately 8 sec
* 3: Approximately 1.4 sec
* 2.9: Approximately 1.2 sec
* 2.8: Approximately 1 sec
* 2.7: Approximately 0.9 sec
* **Daemon:**
* 3.1: Approximately 7.5 sec
* 3: Approximately 1.5 sec
* 2.9: Approximately 1.3 sec
* 2.8: Approximately 1.1 sec
* 2.7: Approximately 1 sec
### Key Observations
* In Chart (a), throughput generally decreases as the parameter value decreases from 3.1 to 2.7, but the differences are relatively small. BF consistently shows the highest throughput across all parameter settings.
* In Chart (b), the 90th percentile packet delay exhibits an inverse relationship with the parameter value. Higher parameter values (3.1) result in significantly higher delays, while lower values (2.7) lead to lower delays. AntNet and OSPF consistently exhibit the highest delays.
* The difference in throughput between the highest and lowest parameter settings is less pronounced than the difference in packet delays.
### Interpretation
These charts compare the performance of different network configurations (AntNet, OSPF, etc.) under varying parameter settings. The throughput chart (a) indicates that BF generally provides the highest data transfer rates, while the packet delay chart (b) reveals that AntNet and OSPF suffer from the most significant delays, especially at higher parameter values.
The inverse relationship between parameter value and packet delay suggests a trade-off between throughput and latency. Increasing the parameter value might improve some aspect of the network that leads to higher throughput, but it also introduces delays. The optimal parameter setting depends on the specific application requirements – whether high throughput or low latency is more critical.
The large difference in delays between parameter 3.1 and 2.7 is notable. This suggests that reducing the parameter value from 3.1 to 2.7 has a substantial impact on reducing latency, potentially making it a worthwhile trade-off even if it slightly reduces throughput. The consistent performance of BF across both charts suggests it is a robust configuration, offering both high throughput and relatively manageable delays.