\n
## Line Chart: Surprisal vs. Training Steps
### Overview
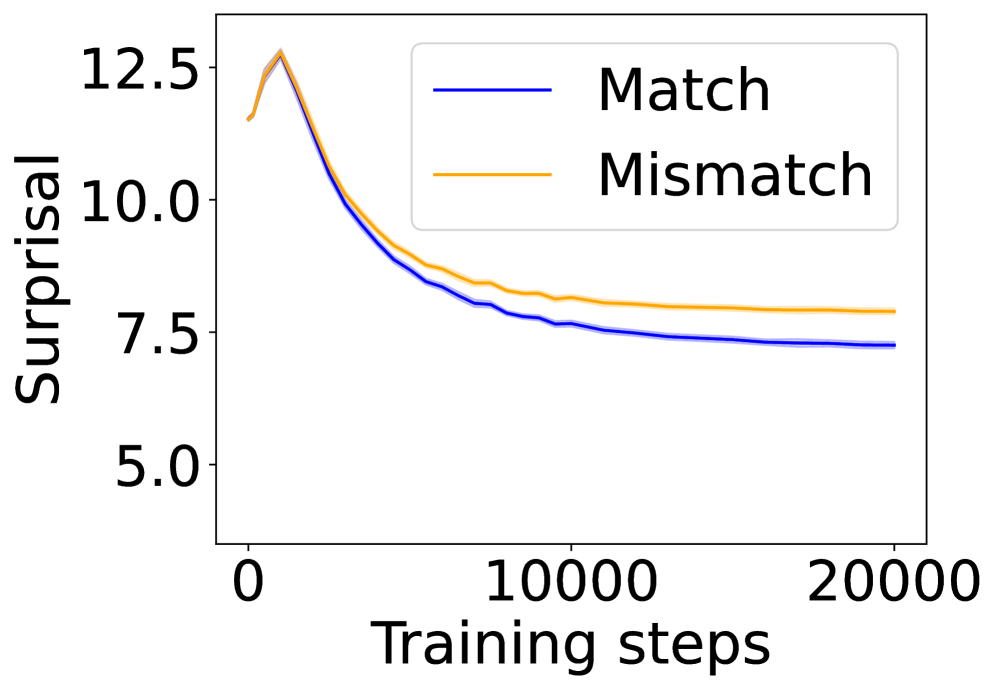
The image presents a line chart illustrating the relationship between "Surprisal" (y-axis) and "Training steps" (x-axis). Two data series are plotted: one representing "Match" and the other "Mismatch". The chart appears to track the surprisal during a training process, potentially in a machine learning context.
### Components/Axes
* **X-axis:** "Training steps", ranging from approximately 0 to 20000. The axis is linearly scaled.
* **Y-axis:** "Surprisal", ranging from approximately 5.0 to 12.5. The axis is linearly scaled.
* **Legend:** Located in the top-right corner of the chart.
* "Match" - represented by a blue line.
* "Mismatch" - represented by an orange line.
### Detailed Analysis
The "Match" line (blue) starts at approximately 7.2 and exhibits a slow, relatively consistent downward trend, leveling off around a surprisal value of 7.0 by 20000 training steps.
The "Mismatch" line (orange) begins at approximately 12.3 and initially decreases more rapidly than the "Match" line. It reaches a minimum around 8000 training steps, with a surprisal value of approximately 7.5. After this point, the "Mismatch" line continues to decrease, but at a much slower rate, approaching a value of approximately 7.2 by 20000 training steps.
Here's a breakdown of approximate data points:
**Match (Blue Line):**
* 0 Training Steps: ~7.2 Surprisal
* 5000 Training Steps: ~7.1 Surprisal
* 10000 Training Steps: ~7.0 Surprisal
* 15000 Training Steps: ~7.0 Surprisal
* 20000 Training Steps: ~7.0 Surprisal
**Mismatch (Orange Line):**
* 0 Training Steps: ~12.3 Surprisal
* 5000 Training Steps: ~8.5 Surprisal
* 10000 Training Steps: ~7.5 Surprisal
* 15000 Training Steps: ~7.3 Surprisal
* 20000 Training Steps: ~7.2 Surprisal
### Key Observations
* Both "Match" and "Mismatch" lines demonstrate a decreasing trend in surprisal as training steps increase, indicating that the model is learning and becoming more confident in its predictions.
* The "Mismatch" line starts with a significantly higher surprisal value than the "Match" line, suggesting that initial mismatches are more surprising or less expected.
* The rate of decrease in surprisal is higher for the "Mismatch" line initially, but it slows down over time, eventually converging towards the "Match" line's surprisal level.
* The "Mismatch" line never falls below the "Match" line, suggesting that mismatches consistently result in higher surprisal values throughout the training process.
### Interpretation
This chart likely represents the surprisal (or perplexity) of a model during training, potentially in a language modeling or sequence prediction task. "Match" could represent the surprisal when the model correctly predicts the next element in a sequence, while "Mismatch" represents the surprisal when the model makes an incorrect prediction.
The decreasing trend in both lines indicates that the model is learning to better predict the sequence, reducing its surprisal over time. The higher initial surprisal for mismatches suggests that the model initially struggles to handle incorrect predictions. The convergence of the two lines towards the end of the training process suggests that the model is becoming more consistent in its predictions, and the difference between correct and incorrect predictions is diminishing.
The fact that the "Mismatch" line remains above the "Match" line throughout the training process suggests that the model never fully eliminates its surprise when encountering mismatches, which is expected. This could be due to inherent noise in the data or limitations in the model's capacity. The chart provides insights into the learning dynamics of the model and its ability to handle both correct and incorrect predictions.