## Line Chart: Model Performance vs. Sample Size
### Overview
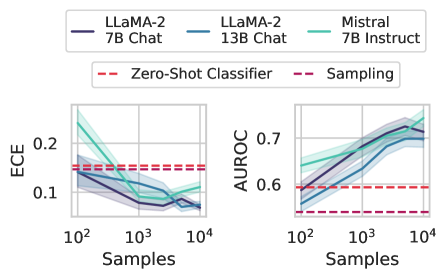
The image contains two line charts comparing the performance of different language models and methods across increasing sample sizes (10² to 10⁴). The left subplot measures Expected Calibration Error (ECE), while the right subplot measures Area Under the Receiver Operating Characteristic curve (AUROC). Performance is visualized with confidence intervals (shaded regions) and benchmark baselines (horizontal dashed lines).
### Components/Axes
- **X-axis**: Samples (logarithmic scale: 10², 10³, 10⁴)
- **Y-axis (Left)**: ECE (0.0 to 0.2)
- **Y-axis (Right)**: AUROC (0.5 to 0.7)
- **Legends**:
- **Top-left**: Model variants (LLama-2 7B Chat, LLama-2 13B Chat, Mistral 7B Instruct)
- **Top-right**: Method types (Zero-Shot Classifier, Sampling)
- **Line styles**:
- Solid lines: Model variants
- Dashed lines: Benchmark baselines
- Shaded regions: 95% confidence intervals
### Detailed Analysis
#### ECE Subplot (Left)
- **Zero-Shot Classifier (red dashed)**: Horizontal line at ~0.15 across all sample sizes.
- **Sampling (purple dashed)**: Horizontal line at ~0.1 across all sample sizes.
- **LLama-2 7B Chat (dark blue solid)**:
- Starts at ~0.18 (10² samples), dips to ~0.12 (10³), then rises to ~0.14 (10⁴).
- **LLama-2 13B Chat (blue solid)**:
- Starts at ~0.16 (10²), dips to ~0.11 (10³), then rises to ~0.13 (10⁴).
- **Mistral 7B Instruct (teal solid)**:
- Starts at ~0.17 (10²), dips to ~0.10 (10³), then rises to ~0.12 (10⁴).
#### AUROC Subplot (Right)
- **Zero-Shot Classifier (red dashed)**: Horizontal line at ~0.6 across all sample sizes.
- **Sampling (purple dashed)**: Horizontal line at ~0.55 across all sample sizes.
- **LLama-2 7B Chat (dark blue solid)**:
- Starts at ~0.58 (10²), rises to ~0.68 (10³), then plateaus at ~0.67 (10⁴).
- **LLama-2 13B Chat (blue solid)**:
- Starts at ~0.59 (10²), rises to ~0.72 (10³), then plateaus at ~0.71 (10⁴).
- **Mistral 7B Instruct (teal solid)**:
- Starts at ~0.61 (10²), rises to ~0.74 (10³), then plateaus at ~0.73 (10⁴).
### Key Observations
1. **Performance Trends**:
- All models improve performance as sample size increases, approaching the Zero-Shot baseline.
- Mistral 7B Instruct and LLama-2 13B Chat outperform the 7B variants in both metrics.
- Sampling method underperforms compared to model-based approaches.
2. **Confidence Intervals**:
- Shaded regions indicate variability, with wider intervals at lower sample sizes (10²) and narrowing as samples increase.
3. **Baseline Comparison**:
- Both ECE and AUROC trends show models converging toward the Zero-Shot baseline as sample size grows, suggesting diminishing returns beyond ~10³ samples.
### Interpretation
The data demonstrates that:
- **Model scale matters**: The 13B variant of LLama-2 and Mistral 7B Instruct achieve higher AUROC and lower ECE than their 7B counterparts, indicating better generalization.
- **Sample efficiency**: Performance gains are most pronounced between 10² and 10³ samples, with diminishing returns at 10⁴.
- **Method limitations**: The Sampling approach lags behind model-based methods, suggesting it may not leverage model capacity effectively.
- **Calibration vs. Accuracy**: While AUROC improves with scale, ECE trends show models becoming more calibrated (lower error) as they approach the Zero-Shot baseline.
This suggests that larger models and instruction-tuned variants (e.g., Mistral) are more sample-efficient, but performance plateaus near the Zero-Shot baseline, highlighting the need for better alignment or training strategies to surpass this ceiling.