## Chart: Model Performance Comparison
### Overview
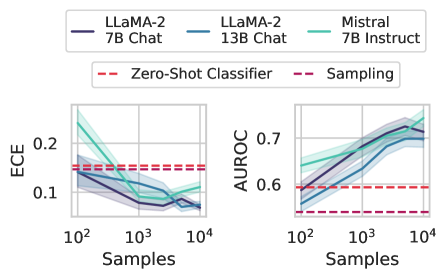
The image presents two line charts comparing the performance of different language models (LLaMA-2 7B Chat, LLaMA-2 13B Chat, and Mistral 7B Instruct) across varying sample sizes. The left chart displays the Expected Calibration Error (ECE), while the right chart shows the Area Under the Receiver Operating Characteristic Curve (AUROC). Baseline performance is indicated by horizontal dashed lines for "Zero-Shot Classifier" and "Sampling".
### Components/Axes
* **X-axis (both charts):** Samples (logarithmic scale), ranging from 10<sup>2</sup> to 10<sup>4</sup>.
* **Y-axis (left chart):** ECE, ranging from 0.1 to 0.2.
* **Y-axis (right chart):** AUROC, ranging from 0.6 to 0.7.
* **Legend (top):**
* Dark Blue: LLaMA-2 7B Chat
* Light Blue: LLaMA-2 13B Chat
* Teal: Mistral 7B Instruct
* Red Dashed: Zero-Shot Classifier
* Purple Dashed: Sampling
### Detailed Analysis
**Left Chart: ECE**
* **LLaMA-2 7B Chat (Dark Blue):** The ECE starts around 0.14 at 10<sup>2</sup> samples and decreases to approximately 0.07 at 10<sup>3</sup> samples. It then plateaus and slightly increases to around 0.08 at 10<sup>4</sup> samples.
* **LLaMA-2 13B Chat (Light Blue):** The ECE starts around 0.17 at 10<sup>2</sup> samples and decreases to approximately 0.08 at 10<sup>3</sup> samples. It then plateaus and slightly increases to around 0.09 at 10<sup>4</sup> samples.
* **Mistral 7B Instruct (Teal):** The ECE starts around 0.23 at 10<sup>2</sup> samples and decreases to approximately 0.10 at 10<sup>3</sup> samples. It then plateaus and slightly increases to around 0.11 at 10<sup>4</sup> samples.
* **Zero-Shot Classifier (Red Dashed):** The ECE is constant at approximately 0.14.
* **Sampling (Purple Dashed):** The ECE is constant at approximately 0.13.
**Right Chart: AUROC**
* **LLaMA-2 7B Chat (Dark Blue):** The AUROC starts around 0.55 at 10<sup>2</sup> samples and increases to approximately 0.72 at 10<sup>4</sup> samples.
* **LLaMA-2 13B Chat (Light Blue):** The AUROC starts around 0.58 at 10<sup>2</sup> samples and increases to approximately 0.73 at 10<sup>4</sup> samples.
* **Mistral 7B Instruct (Teal):** The AUROC starts around 0.60 at 10<sup>2</sup> samples and increases to approximately 0.74 at 10<sup>4</sup> samples.
* **Zero-Shot Classifier (Red Dashed):** The AUROC is constant at approximately 0.59.
* **Sampling (Purple Dashed):** The AUROC is constant at approximately 0.53.
### Key Observations
* As the number of samples increases, the ECE generally decreases for all three language models, indicating better calibration.
* As the number of samples increases, the AUROC generally increases for all three language models, indicating better classification performance.
* Mistral 7B Instruct generally outperforms the LLaMA-2 models in both ECE and AUROC, especially at lower sample sizes.
* The Zero-Shot Classifier and Sampling baselines remain constant across all sample sizes.
### Interpretation
The charts demonstrate the impact of increasing the number of samples on the performance of different language models. The decreasing ECE and increasing AUROC values suggest that with more data, the models become better calibrated and more accurate in their classifications. The Mistral 7B Instruct model appears to be the most effective among the three, showing superior performance compared to the LLaMA-2 models. The horizontal baselines provide a reference point, highlighting the improvement achieved by the language models compared to simpler classification methods. The logarithmic scale on the x-axis suggests that the initial increase in samples has a more significant impact on performance than later increases.