## Chart: Optimal Panning Gains for Varying Acoustic Covariances
### Overview
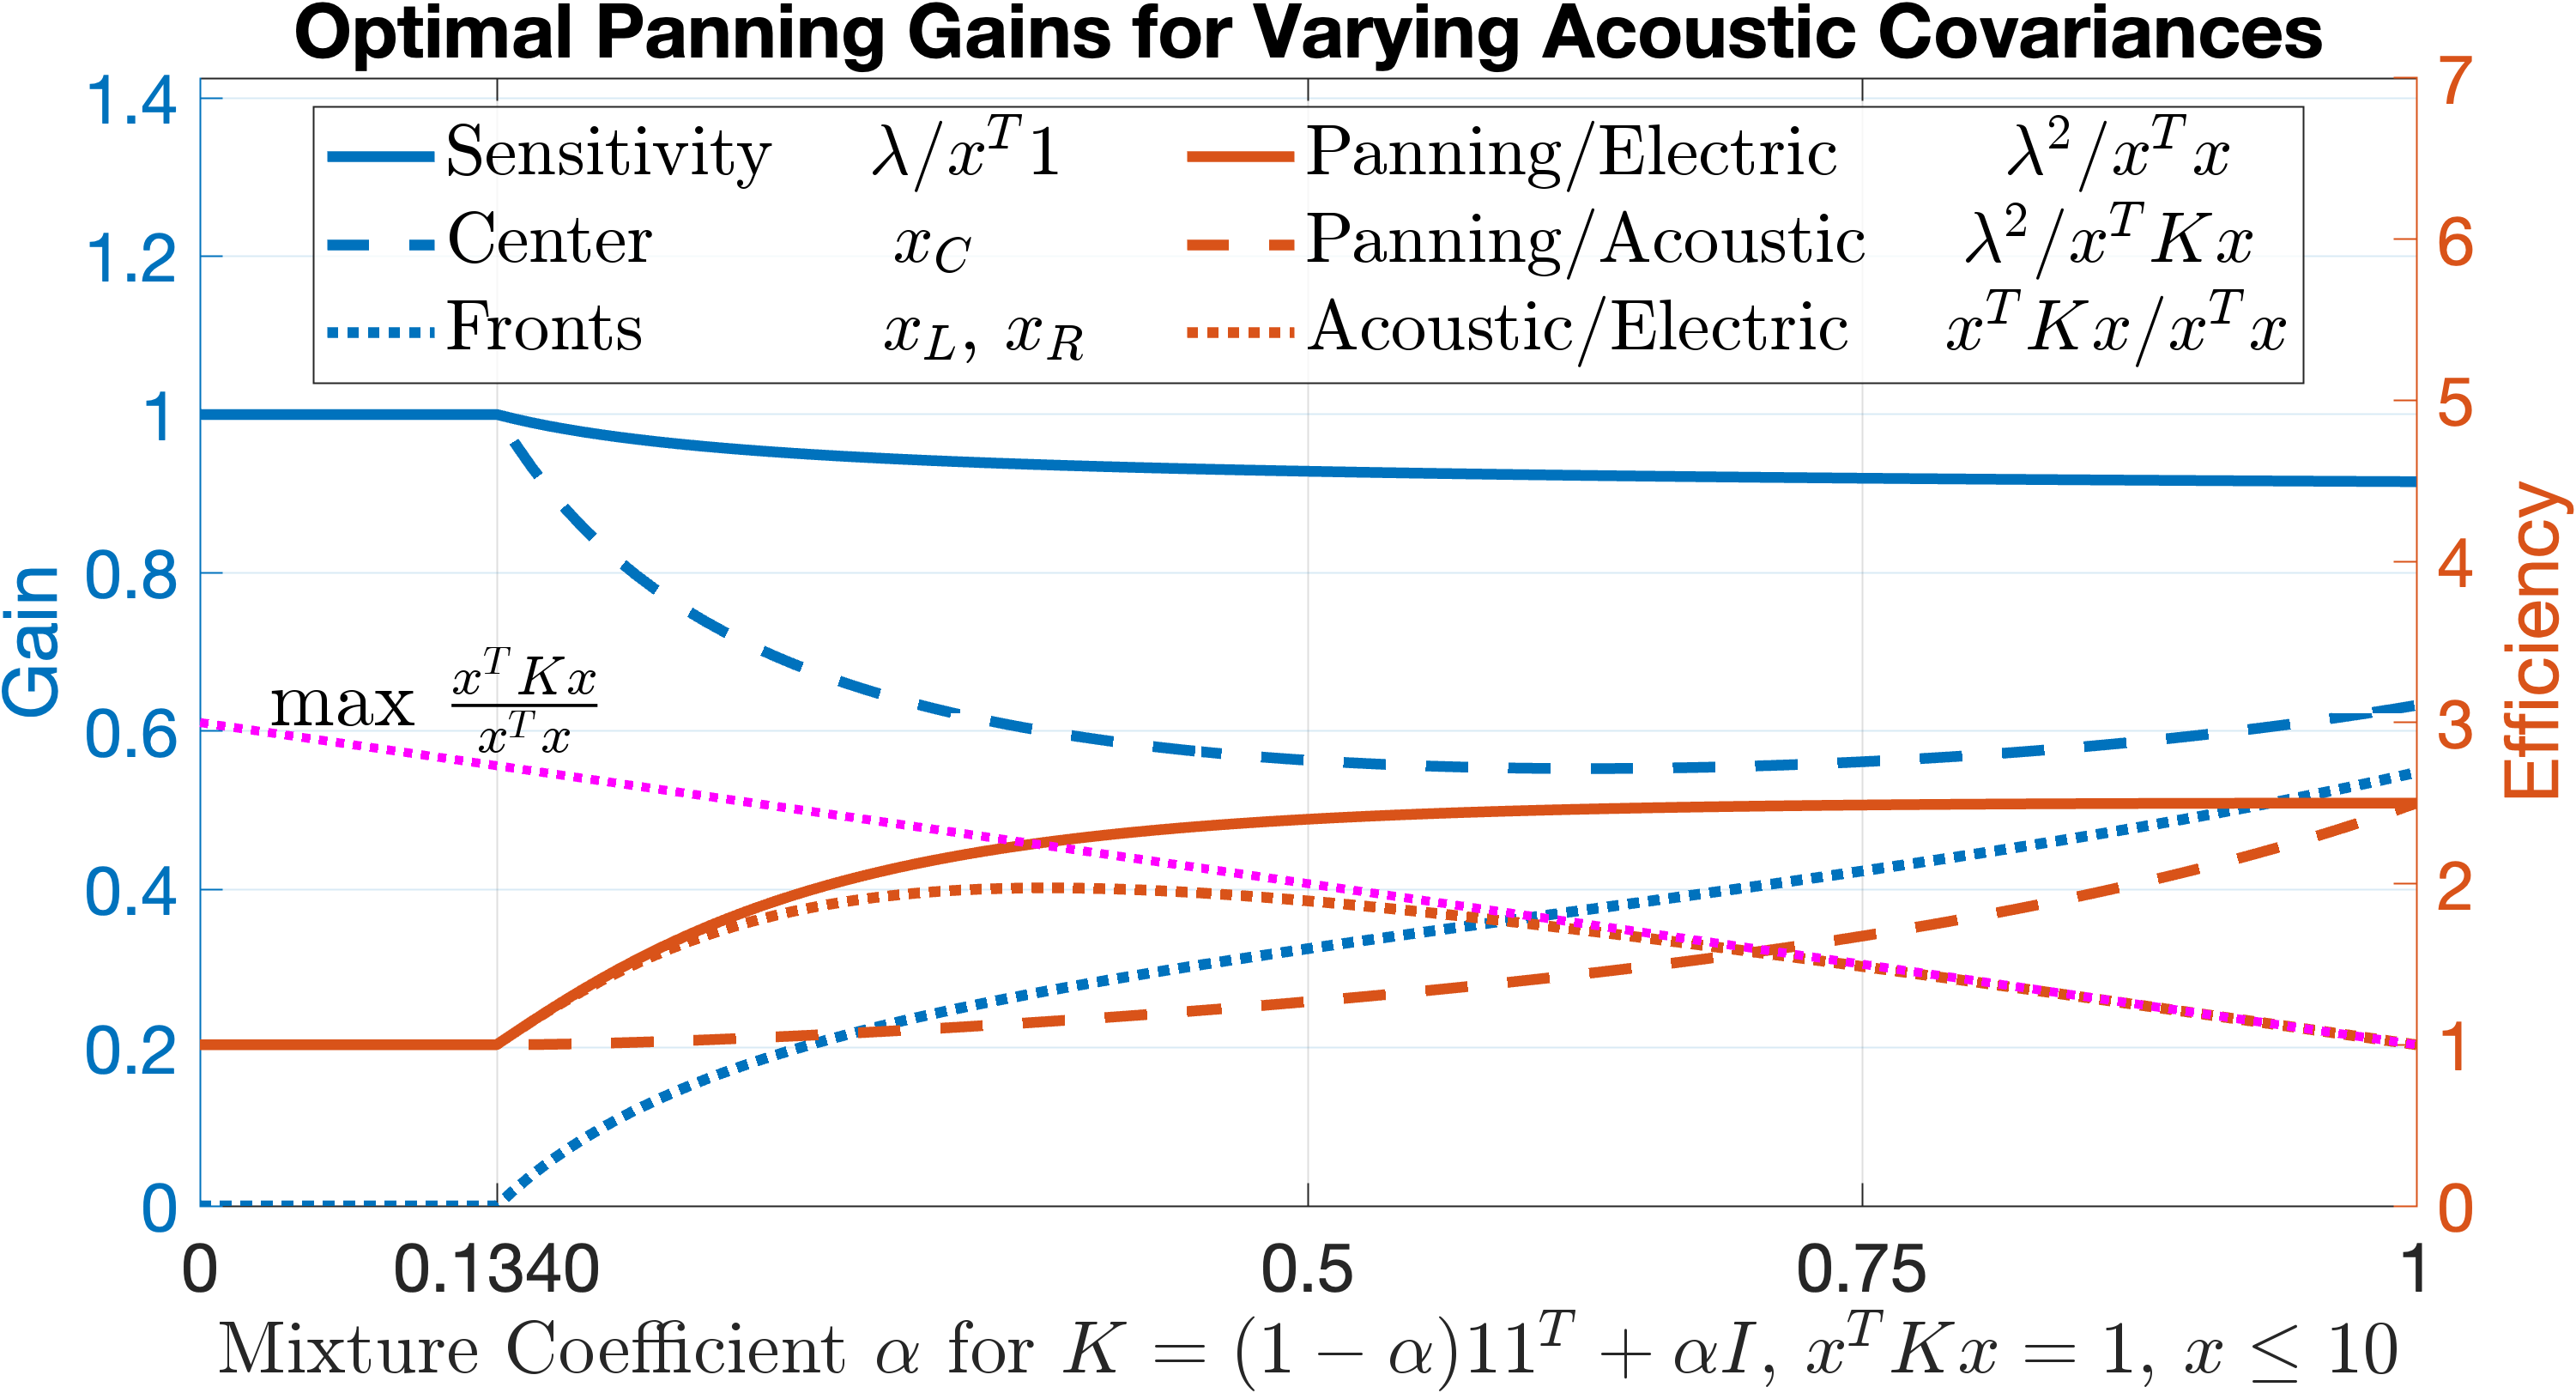
The image is a line chart comparing different panning gain strategies against a mixture coefficient alpha. The chart plots "Gain" on the primary y-axis (left) and "Efficiency" on the secondary y-axis (right), both as functions of the "Mixture Coefficient α" on the x-axis. Several panning methods are compared, including sensitivity, center, fronts, panning/electric, panning/acoustic, and acoustic/electric.
### Components/Axes
* **Title:** Optimal Panning Gains for Varying Acoustic Covariances
* **X-axis:**
* Label: Mixture Coefficient α for K = (1 − α)11ᵀ + αI, xᵀKx = 1, x ≤ 10
* Scale: 0 to 1, with markers at 0, 0.1340, 0.5, 0.75, and 1.
* **Y-axis (Left):**
* Label: Gain
* Scale: 0 to 1.4, with markers at 0, 0.2, 0.4, 0.6, 0.8, 1, 1.2, and 1.4.
* **Y-axis (Right):**
* Label: Efficiency
* Scale: 0 to 7, with markers at 0, 1, 2, 3, 4, 5, 6, and 7.
* **Legend (Top-Left):**
* Sensitivity (Solid Blue Line): λ/xᵀ1
* Center (Dashed Blue Line): xC
* Fronts (Dotted Blue Line): xL, xR
* **Legend (Top-Right):**
* Panning/Electric (Solid Orange Line): λ²/xᵀx
* Panning/Acoustic (Dashed Orange Line): λ²/xᵀKx
* Acoustic/Electric (Dotted Orange Line): xᵀKx/xᵀx
* **Additional Text:** max xᵀKx / xᵀx (Located around coordinates x=0.2, y=0.6)
### Detailed Analysis
* **Sensitivity (Solid Blue Line):** Starts at a Gain of 1.0 at α = 0, remains relatively constant around 0.92 after α = 0.5.
* **Center (Dashed Blue Line):** Starts at a Gain of 1.0 at α = 0, decreases to approximately 0.6 at α = 0.5, and then increases slightly to approximately 0.65 at α = 1.
* **Fronts (Dotted Blue Line):** Starts at a Gain of 0 at α = 0, increases to approximately 0.2 at α = 0.5, and continues to increase to approximately 0.25 at α = 1.
* **Panning/Electric (Solid Orange Line):** Starts at an Efficiency of 1 at α = 0, remains constant until α = 0.1340, then increases to approximately 2.5 at α = 0.5, and continues to increase to approximately 2.7 at α = 1.
* **Panning/Acoustic (Dashed Orange Line):** Starts at an Efficiency of 1 at α = 0, remains constant until α = 0.1340, then increases to approximately 1.8 at α = 0.5, and continues to increase to approximately 2.2 at α = 1.
* **Acoustic/Electric (Dotted Orange Line):** Starts at an Efficiency of 0 at α = 0, increases to approximately 2 at α = 0.5, and continues to increase to approximately 2.5 at α = 1.
* **max xᵀKx / xᵀx (Dotted Magenta Line):** Starts at a Gain of approximately 0.6 at α = 0, and decreases to approximately 0.2 at α = 1.
### Key Observations
* The "Sensitivity" gain remains relatively stable across the range of mixture coefficients.
* The "Center" gain decreases initially and then slightly increases.
* The "Fronts" gain consistently increases with the mixture coefficient.
* The "Panning/Electric," "Panning/Acoustic," and "Acoustic/Electric" efficiencies all increase with the mixture coefficient.
* The "max xᵀKx / xᵀx" gain decreases with the mixture coefficient.
### Interpretation
The chart illustrates how different panning strategies perform under varying acoustic covariance conditions, controlled by the mixture coefficient α. The "Sensitivity" method appears to be the most stable, while the other methods exhibit more dynamic behavior. The increasing efficiencies of "Panning/Electric," "Panning/Acoustic," and "Acoustic/Electric" suggest that these methods become more effective as the acoustic environment changes. The decreasing "max xᵀKx / xᵀx" gain indicates a trade-off or limitation in maximizing this particular function as the mixture coefficient increases. The data suggests that the optimal panning strategy depends on the specific acoustic environment and the desired performance characteristics.