\n
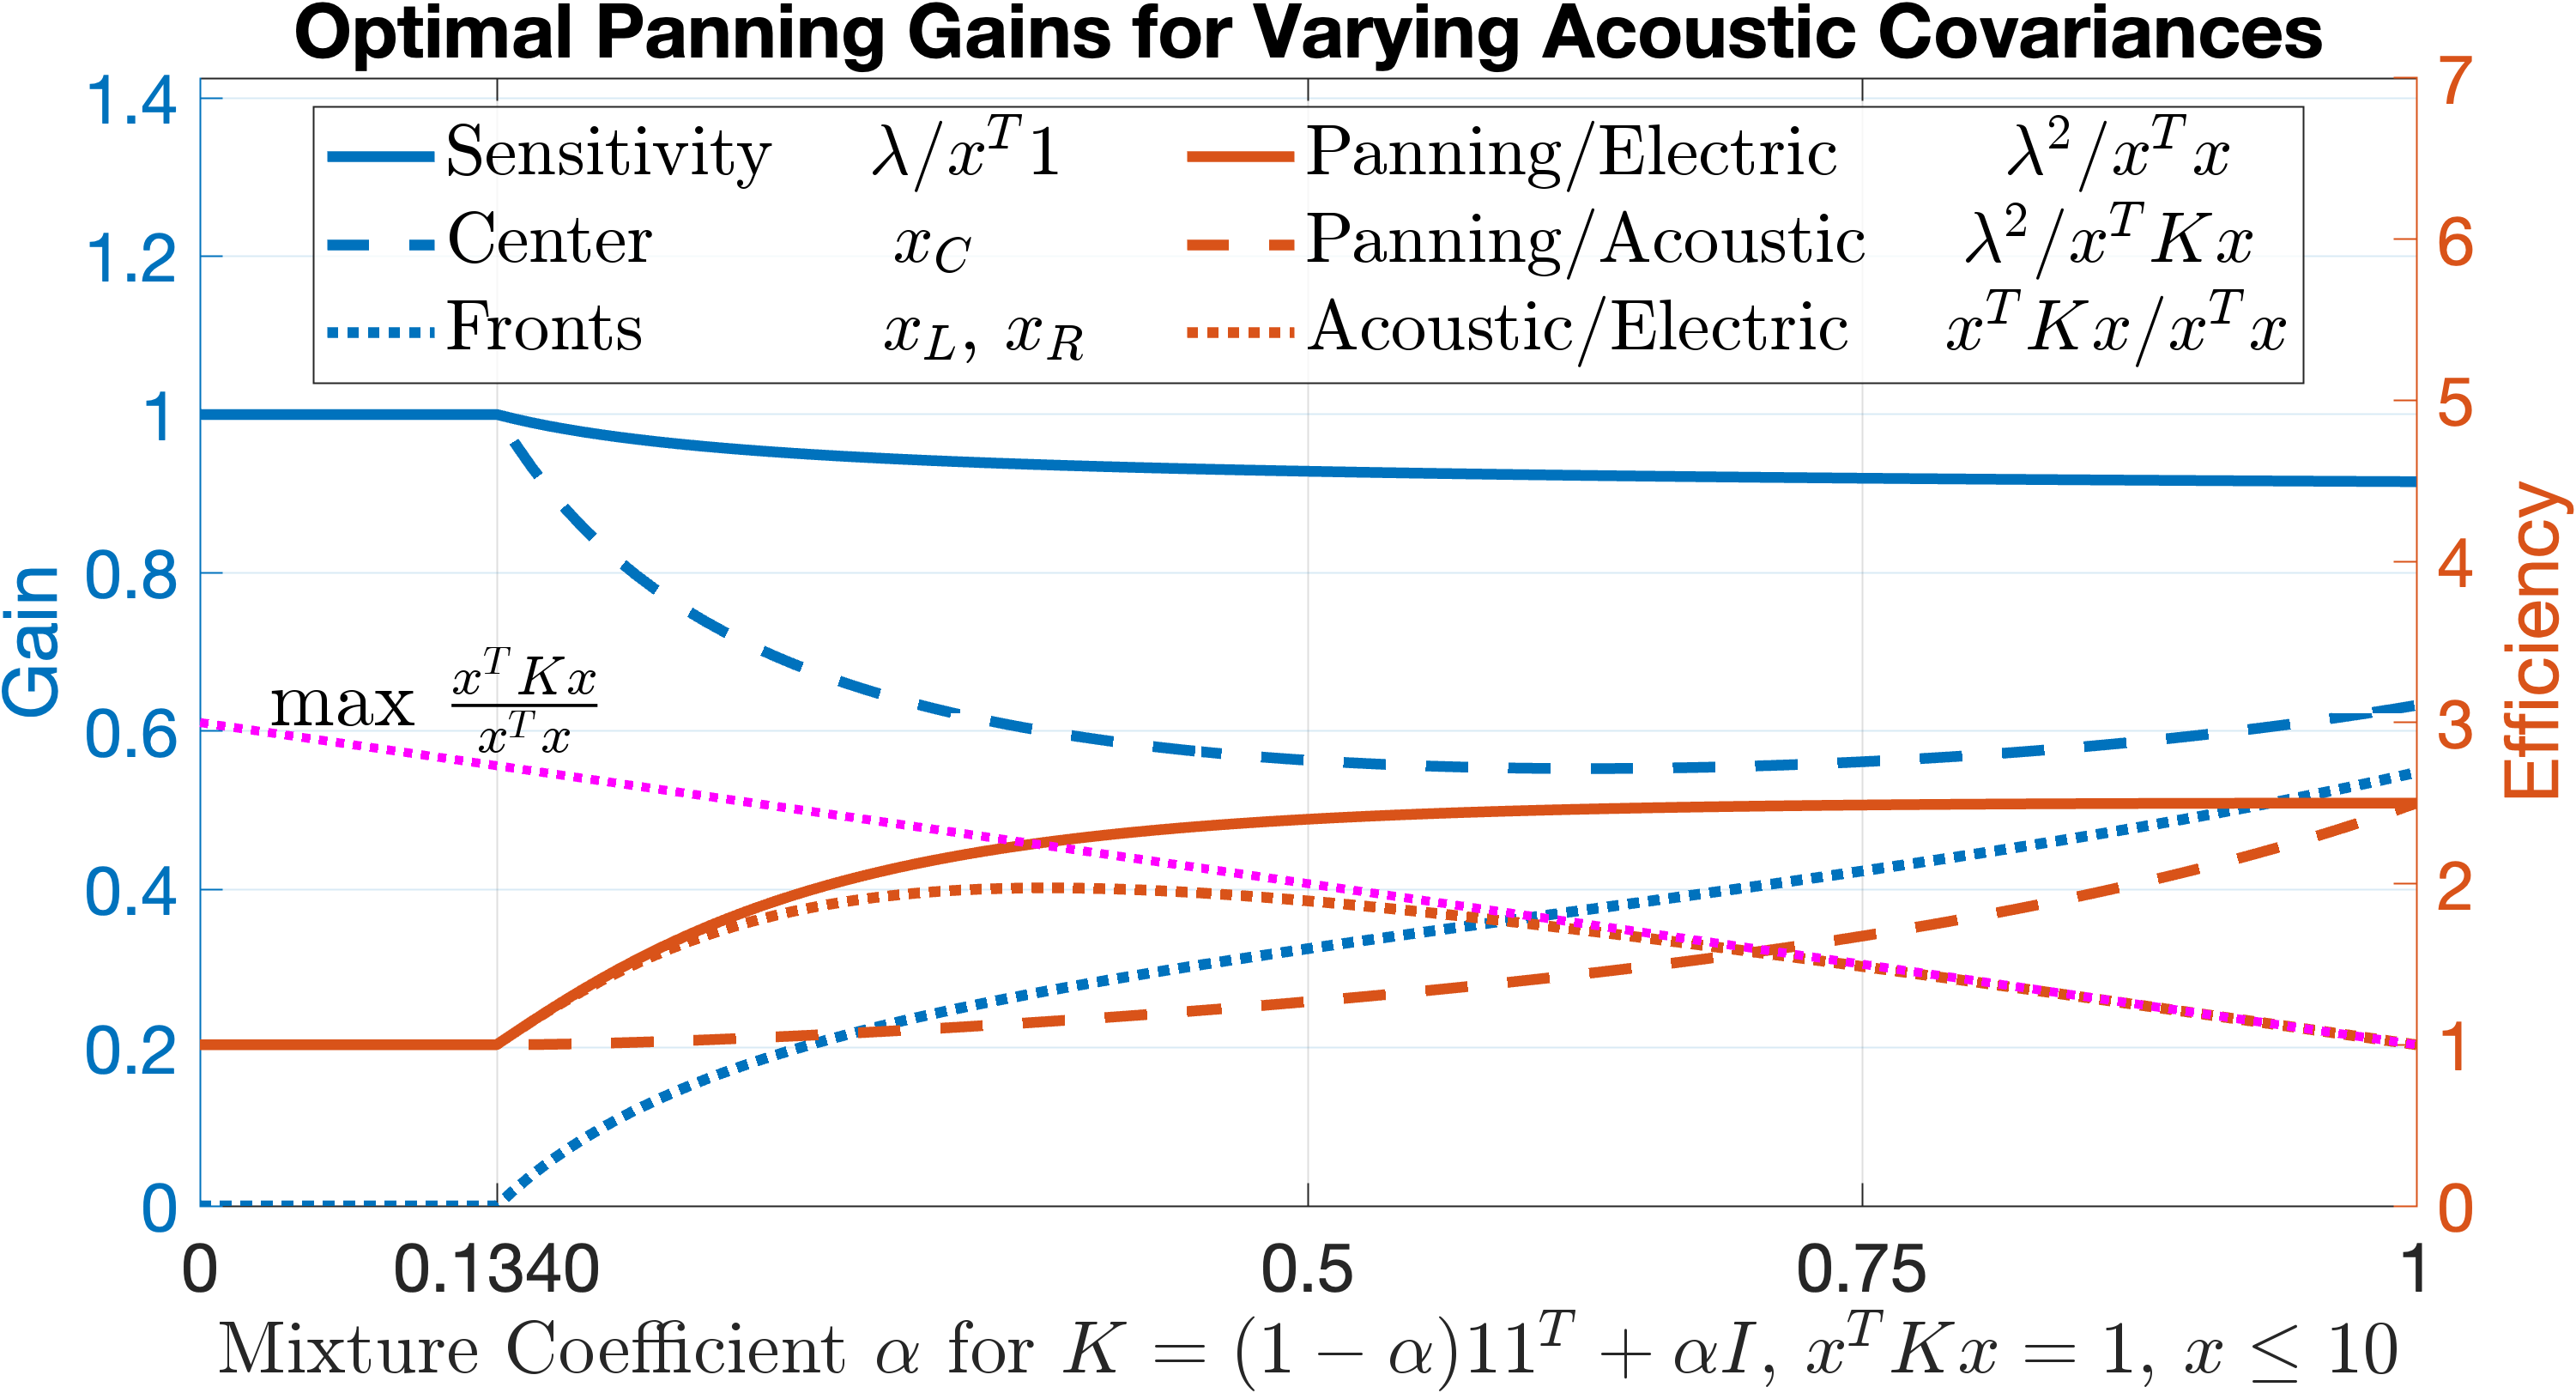
## Chart: Optimal Panning Gains for Varying Acoustic Covariances
### Overview
The image presents a line chart illustrating the relationship between "Mixture Coefficient α" (on the x-axis) and "Gain" (on the primary y-axis) and "Efficiency" (on the secondary y-axis) for various acoustic covariance scenarios. The chart explores optimal panning gains under different conditions, with multiple lines representing different metrics.
### Components/Axes
* **Title:** Optimal Panning Gains for Varying Acoustic Covariances
* **X-axis:** Mixture Coefficient α. Scale ranges from 0 to 1, with a marked point at 0.1340. The equation `K = (1 - α)I + αL, xᵀKx = 1, x ≤ 10` is provided below the axis.
* **Primary Y-axis (left):** Gain. Scale ranges from 0 to 1.4.
* **Secondary Y-axis (right):** Efficiency. Scale ranges from 0 to 7.
* **Legend:** Located at the top-right of the chart. Contains the following lines and their corresponding colors:
* Sensitivity (Blue) - λ/xᵀ¹
* Center (Magenta) - xC
* Fronts (Cyan) - xL, xR
* Panning/Electric (Orange) - λ²/xᵀx
* Panning/Acoustic (Red-Orange) - λ²/xᵀKx
* Acoustic/Electric (Brown) - xᵀKx/xᵀx
* **Gridlines:** Present to aid in reading values.
### Detailed Analysis
The chart displays six distinct lines, each representing a different metric.
1. **Sensitivity (Blue):** This line starts at approximately 1.35 at α = 0, and remains relatively constant at around 0.95-1.0 across the entire range of α, with a slight downward trend.
2. **Center (Magenta):** This line exhibits a steep downward slope. It starts at approximately 1.2 at α = 0 and decreases rapidly to around 0.45 at α = 0.1340, then continues to decrease more slowly, reaching approximately 0.3 at α = 1.
3. **Fronts (Cyan):** This line starts at approximately 0.65 at α = 0 and decreases gradually to around 0.55 at α = 0.1340, then remains relatively constant at around 0.5-0.6 across the rest of the range.
4. **Panning/Electric (Orange):** This line starts at approximately 0.2 at α = 0 and increases steadily to around 0.45 at α = 0.1340, then continues to increase more slowly, reaching approximately 0.55 at α = 1.
5. **Panning/Acoustic (Red-Orange):** This line starts at approximately 0.2 at α = 0 and increases rapidly to around 0.45 at α = 0.1340, then continues to increase more slowly, reaching approximately 0.55 at α = 1.
6. **Acoustic/Electric (Brown):** This line starts at approximately 0.1 at α = 0 and increases steadily to around 0.3 at α = 0.1340, then continues to increase more slowly, reaching approximately 0.4 at α = 1.
The secondary y-axis (Efficiency) provides a scale for the lines, with values ranging from 0 to 7. The Efficiency values generally correlate with the Gain values, but with different magnitudes.
### Key Observations
* The "Center" metric exhibits the most significant change in Gain across the range of α.
* The "Sensitivity" metric remains relatively stable, indicating consistent performance regardless of the mixture coefficient.
* The "Panning/Electric" and "Panning/Acoustic" lines show similar trends, suggesting a strong relationship between these two metrics.
* The point at α = 0.1340 appears to be a critical point where the slopes of several lines change significantly.
### Interpretation
This chart demonstrates how optimal panning gains are affected by varying acoustic covariances, as represented by the mixture coefficient α. The different lines represent different metrics used to evaluate the performance of the panning system. The steep decline in the "Center" metric suggests that the center channel becomes less effective as the mixture coefficient increases. The relatively stable "Sensitivity" metric indicates that the system maintains a consistent level of sensitivity regardless of the acoustic conditions. The similar trends observed in the "Panning/Electric" and "Panning/Acoustic" metrics suggest that these two factors are closely related. The critical point at α = 0.1340 may represent a transition point where the system's behavior changes significantly.
The chart provides valuable insights for designing and optimizing panning systems in various acoustic environments. By understanding the relationship between the mixture coefficient and the different metrics, engineers can select appropriate panning gains to achieve optimal performance. The inclusion of the Efficiency axis allows for a more comprehensive evaluation of the system's performance, taking into account both the Gain and the energy consumption.