## Diagram: Data Flow Architecture
### Overview
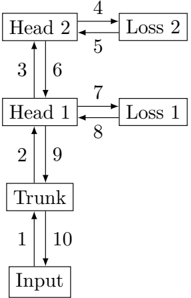
The diagram illustrates a multi-stage data processing pipeline with bidirectional connections between components. It features an Input node feeding into a Trunk, which splits into two parallel processing paths (Head 1 and Head 2). Each head connects to a dedicated Loss function, with numerical labels indicating directional relationships or transformation weights.
### Components/Axes
- **Nodes**:
- Input (bottom)
- Trunk (central)
- Head 1 (upper-left)
- Head 2 (upper-right)
- Loss 1 (right-center)
- Loss 2 (far-right)
- **Connections**:
- Arrows with numerical labels (1-10) indicate directional flow or parameter weights
- No explicit legend or color-coding present
### Detailed Analysis
1. **Input → Trunk**:
- Two bidirectional connections labeled 1 (Input→Trunk) and 10 (Trunk→Input)
2. **Trunk → Heads**:
- Trunk→Head 1: Labeled 2 (forward) and 9 (backward)
- Trunk→Head 2: Labeled 3 (forward) and 6 (backward)
3. **Heads → Loss Functions**:
- Head 1→Loss 1: Labeled 7 (forward) and 8 (backward)
- Head 2→Loss 2: Labeled 4 (forward) and 5 (backward)
### Key Observations
- Bidirectional flow exists between all connected components
- Numerical labels increase sequentially from Input to Loss functions (1-10)
- Loss functions only receive forward connections from their respective heads
- No explicit temporal or hierarchical ordering beyond the numerical labels
### Interpretation
This diagram likely represents a neural network architecture or optimization pipeline where:
1. Input data flows through a central processing unit (Trunk)
2. Parallel processing occurs in two heads, each specializing in different feature extraction
3. Loss functions evaluate the output quality of each head
4. Bidirectional connections suggest feedback mechanisms for error correction or iterative refinement
The numerical labels (1-10) may represent:
- Processing stages/steps
- Weight magnitudes in a computational graph
- Iteration counts in an optimization loop
- Data transformation parameters
The architecture emphasizes parallel processing with dedicated evaluation paths, suggesting a system designed for comparative analysis between Head 1 and Head 2 outputs. The absence of explicit error metrics or performance indicators limits quantitative interpretation.