# Technical Document Extraction: Line Chart Analysis
## Chart Overview
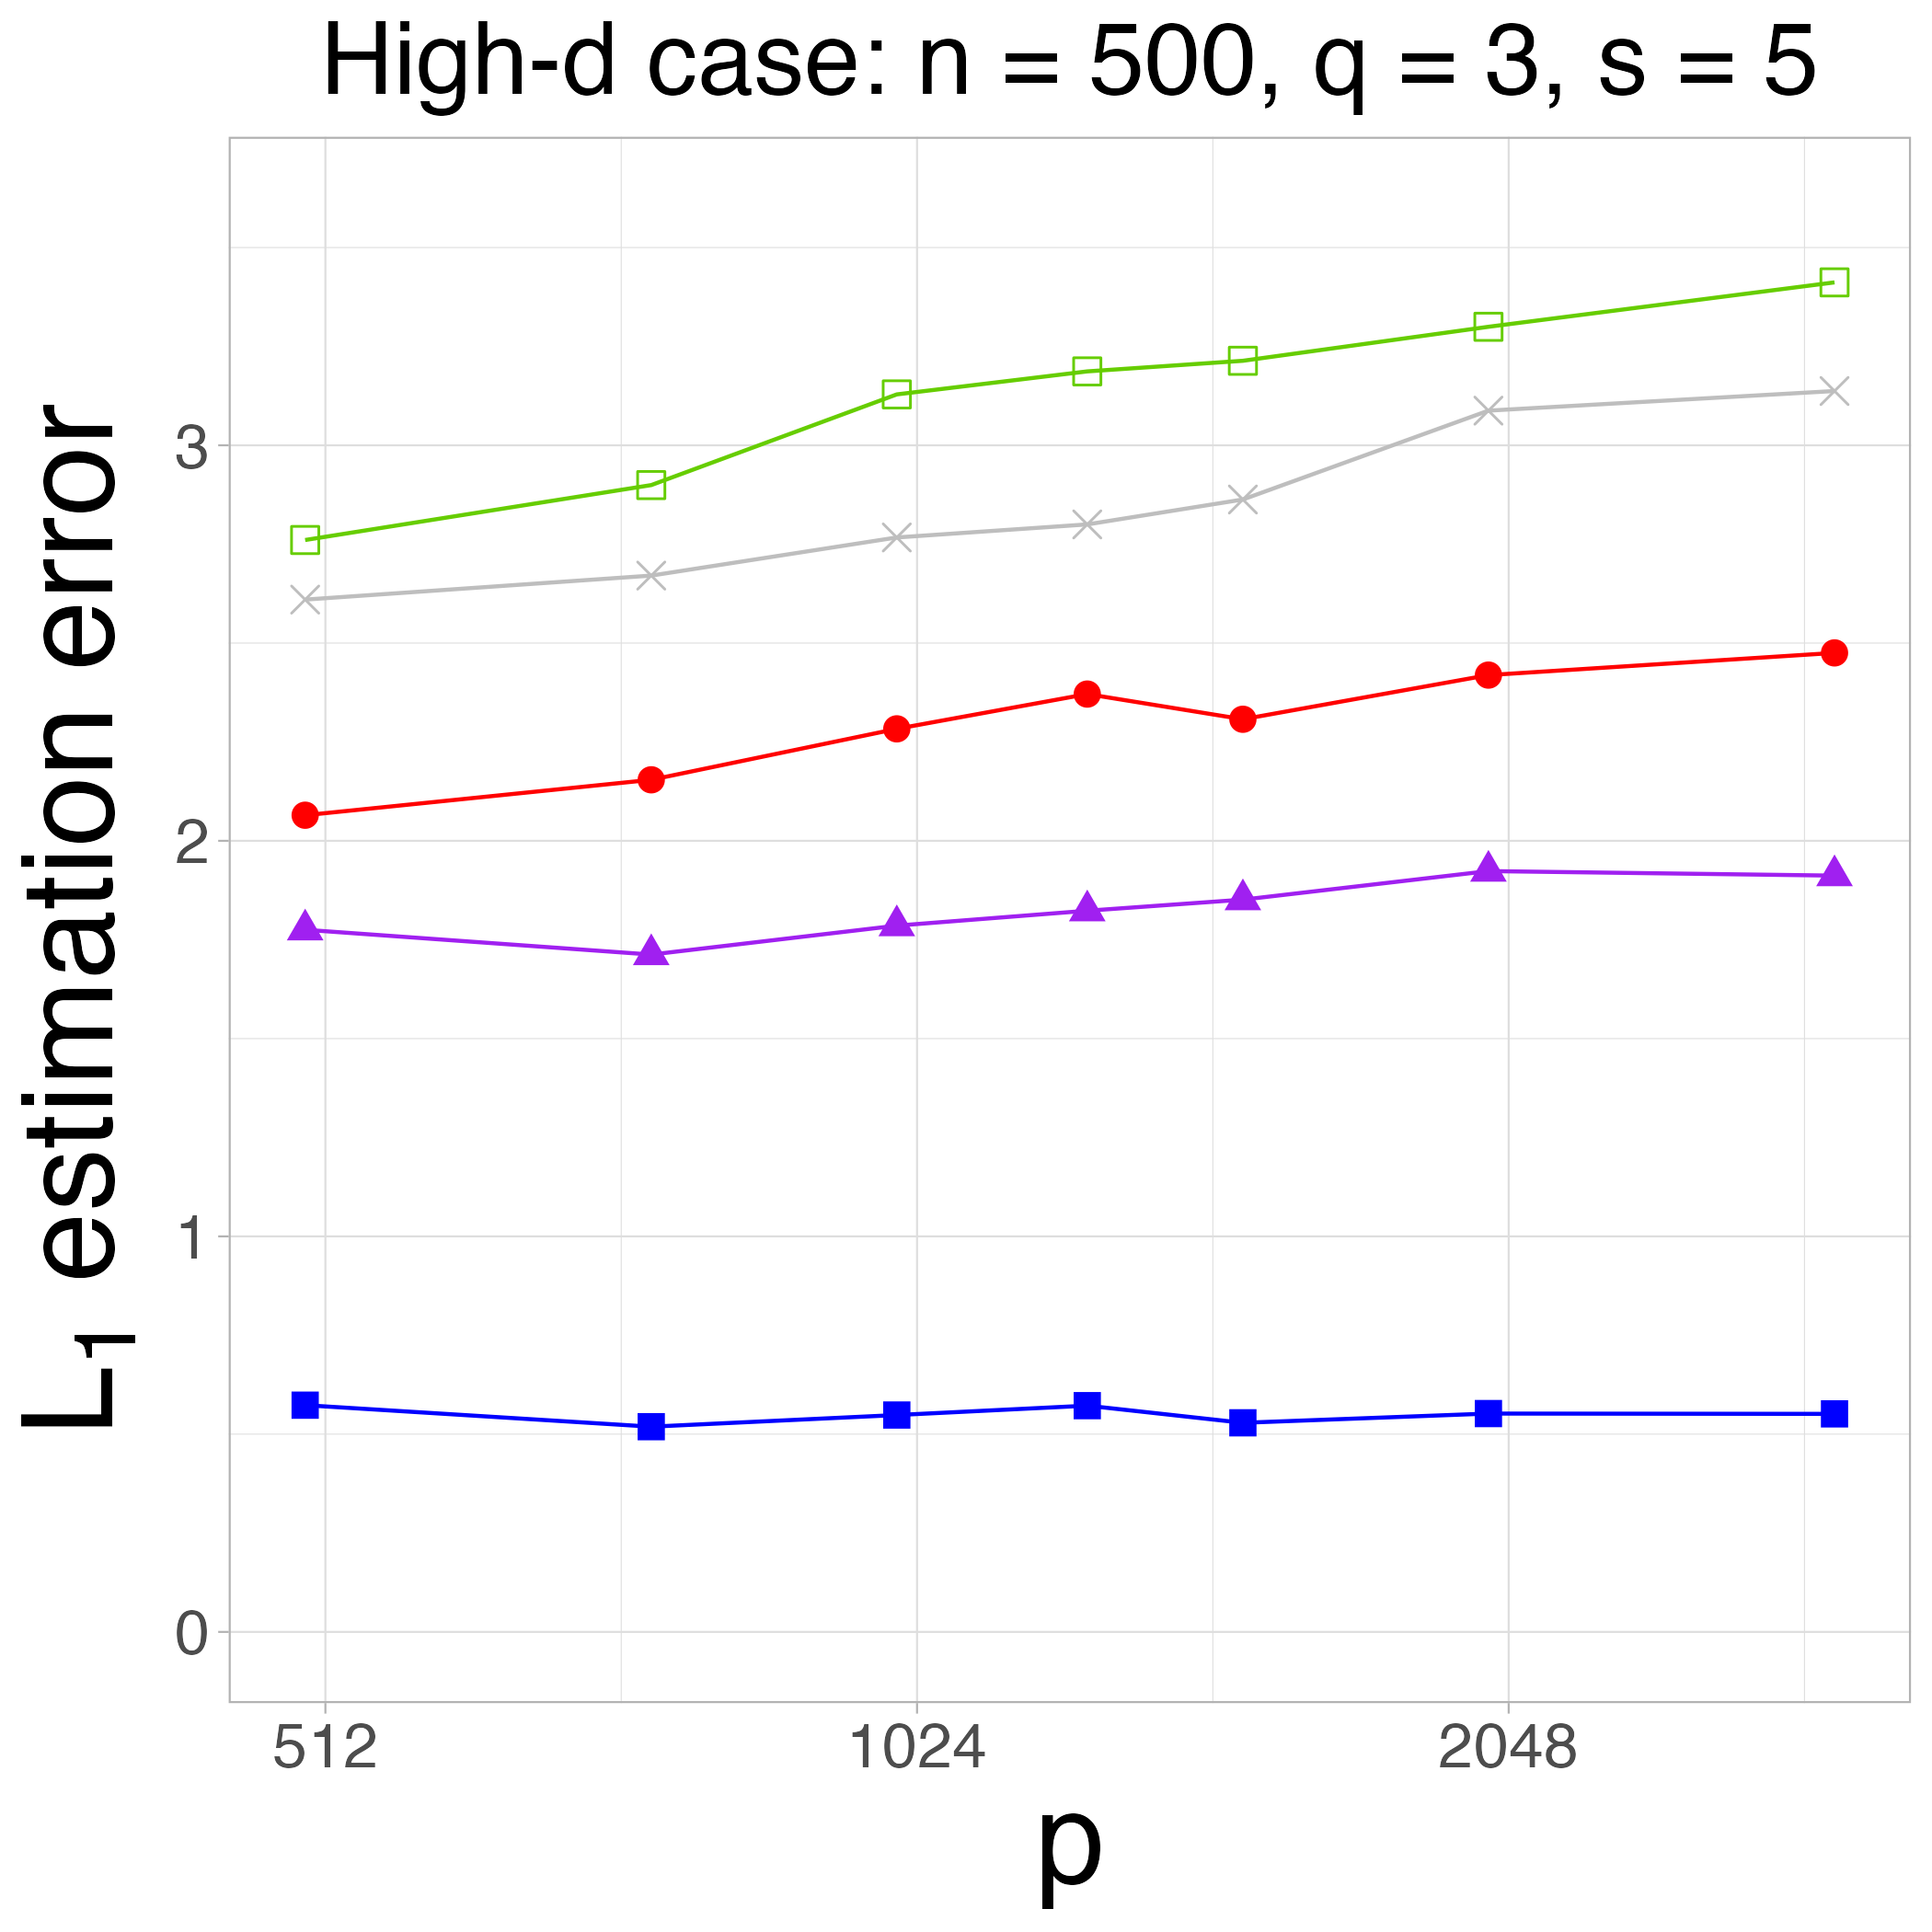
- **Title**: High-d case: n = 500, q = 3, s = 5
- **Type**: Line chart
- **Purpose**: Visualizes L₁ estimation error across varying parameter `p`
---
## Axis Labels
- **X-axis**: `p` (Parameter values: 512, 1024, 2048, 4096)
- **Y-axis**: `L₁ estimation error` (Range: 0 to 3.5)
---
## Legend
- **Location**: Top-right corner
- **Entries**:
1. **Green squares**: `q=3, s=5`
2. **Gray crosses**: `q=3, s=10`
3. **Red circles**: `q=5, s=5`
4. **Purple triangles**: `q=5, s=10`
---
## Data Series & Trends
### 1. Green Squares (`q=3, s=5`)
- **Trend**: Steady upward slope
- **Data Points**:
- p=512: ~2.7
- p=1024: ~3.1
- p=2048: ~3.3
- p=4096: ~3.5
### 2. Gray Crosses (`q=3, s=10`)
- **Trend**: Gradual increase with minor fluctuations
- **Data Points**:
- p=512: ~2.6
- p=1024: ~2.8
- p=2048: ~3.1
- p=4096: ~3.2
### 3. Red Circles (`q=5, s=5`)
- **Trend**: Slight dip at p=1024, then upward trend
- **Data Points**:
- p=512: ~2.1
- p=1024: ~2.3
- p=2048: ~2.4
- p=4096: ~2.5
### 4. Purple Triangles (`q=5, s=10`)
- **Trend**: Flat with slight rise at higher `p`
- **Data Points**:
- p=512: ~1.8
- p=1024: ~1.85
- p=2048: ~1.95
- p=4096: ~1.9
---
## Key Observations
1. **Parameter Impact**:
- Higher `s` values (10 vs. 5) generally correlate with lower estimation errors.
- `q=5` configurations (red/purple lines) show more stability than `q=3`.
2. **Error Magnitude**:
- Errors scale linearly with `p` for `q=3` cases.
- `q=5` cases exhibit bounded error growth.
3. **Legend Consistency**:
- All line colors/markers match legend entries exactly.
- No mismatches detected between visual elements and labels.
---
## Spatial Grounding
- **Legend Position**: Top-right (x=0.95, y=0.95 relative to plot area)
- **Data Point Alignment**: All markers align with their respective legend symbols.
---
## Missing Elements
- No additional text blocks, tables, or annotations present.
- No secondary y-axis or colorbar.
---
## Conclusion
The chart demonstrates how `L₁ estimation error` evolves with parameter `p` under different `q` and `s` configurations. Higher `s` values reduce error growth, while increased `q` stabilizes error trajectories.