**Technical Document Extraction: Line Chart Analysis**
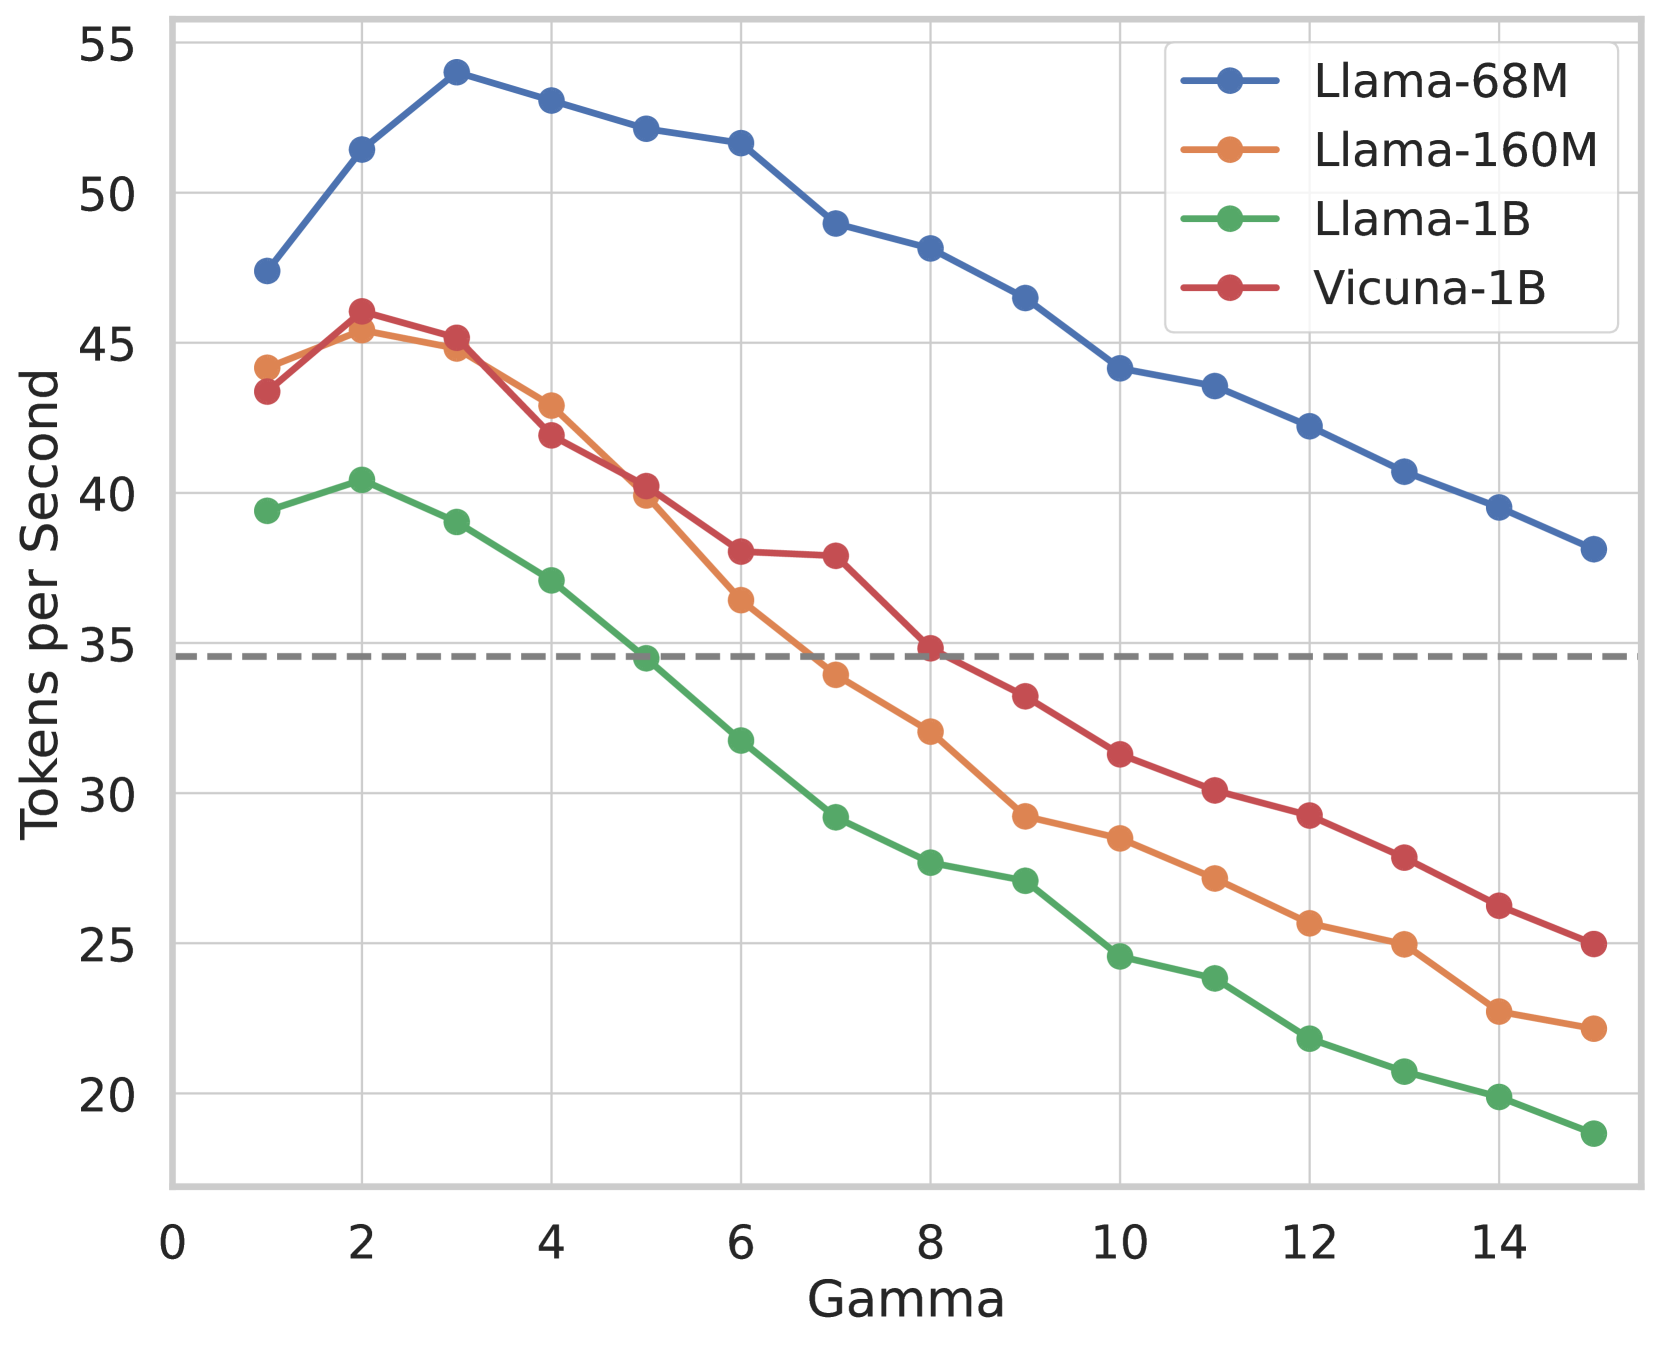
**Chart Type**: Line chart with four data series.
**Axes**:
- **X-axis (Horizontal)**: Labeled "Gamma" with integer markers from 0 to 15.
- **Y-axis (Vertical)**: Labeled "Tokens per Second" with integer markers from 20 to 55. A dashed horizontal line at **35** is present.
**Legend**:
- **Blue line**: Llama-68M
- **Orange line**: Llama-160M
- **Green line**: Llama-1B
- **Red line**: Vicuna-1B
**Key Trends**:
1. **Llama-68M (Blue)**:
- Starts at ~47 tokens/sec at Gamma=0.
- Peaks at ~54 tokens/sec at Gamma=3.
- Gradually declines to ~38 tokens/sec at Gamma=15.
- Maintains the highest performance across all Gamma values.
2. **Llama-160M (Orange)**:
- Begins at ~44 tokens/sec at Gamma=0.
- Drops sharply to ~35 tokens/sec by Gamma=5.
- Continues declining to ~22 tokens/sec at Gamma=15.
- Crosses below Llama-1B at Gamma=4.
3. **Llama-1B (Green)**:
- Starts at ~39 tokens/sec at Gamma=0.
- Declines steadily to ~20 tokens/sec by Gamma=10.
- Reaches ~18 tokens/sec at Gamma=15.
- Crosses below the 35-token threshold at Gamma=5.
4. **Vicuna-1B (Red)**:
- Begins at ~43 tokens/sec at Gamma=0.
- Drops to ~35 tokens/sec by Gamma=5.
- Continues declining to ~25 tokens/sec at Gamma=15.
- Crosses below Llama-160M at Gamma=3.
**Critical Observations**:
- **Performance Threshold**: The dashed line at 35 tokens/sec acts as a performance benchmark. All models except Llama-68M fall below this threshold by Gamma=8.
- **Model Efficiency**: Llama-68M demonstrates superior scalability, retaining higher token generation rates across increasing Gamma values compared to other models.
- **Divergence Points**:
- Llama-160M and Vicuna-1B intersect near Gamma=3 (~42 tokens/sec).
- Llama-1B falls below Llama-160M at Gamma=4 (~38 tokens/sec).
**Data Points (Selected)**:
- **Llama-68M**:
- Gamma=0: 47
- Gamma=3: 54
- Gamma=15: 38
- **Llama-160M**:
- Gamma=0: 44
- Gamma=5: 35
- Gamma=15: 22
- **Llama-1B**:
- Gamma=0: 39
- Gamma=5: 35
- Gamma=15: 18
- **Vicuna-1B**:
- Gamma=0: 43
- Gamma=5: 35
- Gamma=15: 25
**Conclusion**:
The chart illustrates a trade-off between model size (Llama variants) and performance efficiency (Tokens per Second) as Gamma increases. Llama-68M maintains dominance, while smaller models (Llama-160M, Llama-1B) and Vicuna-1B exhibit steeper declines, highlighting diminishing returns at higher Gamma values.