# Technical Document Extraction: Control Effect Analysis
## Left Panel: Line Graphs (Control Effect vs. # Examples)
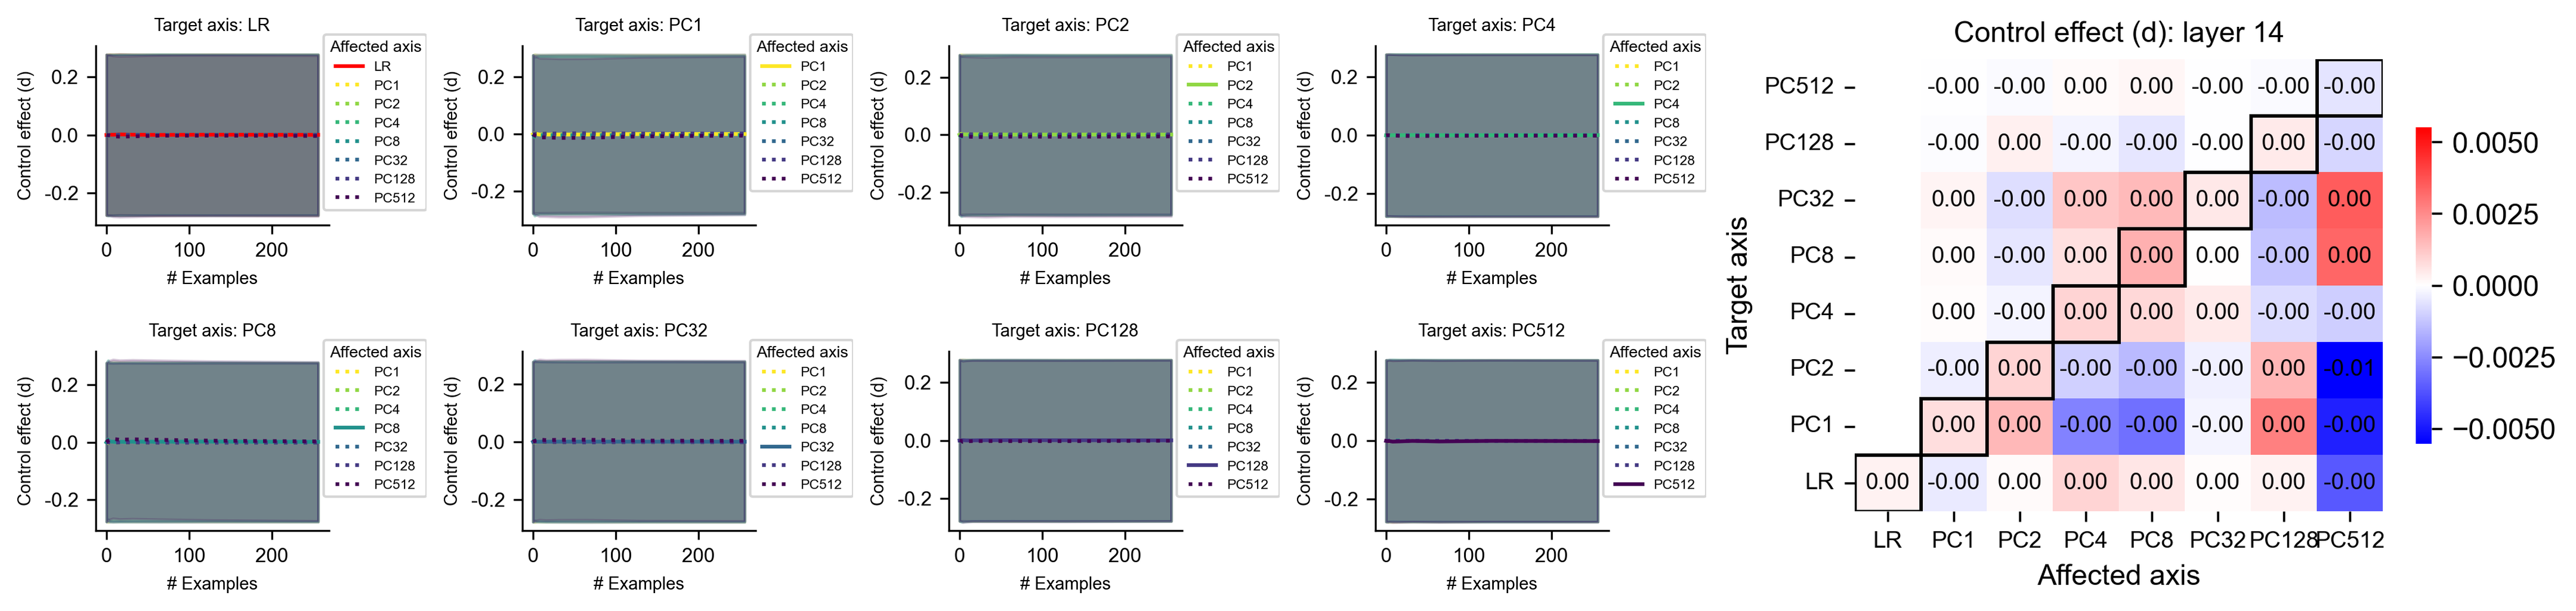
Eight line graphs depict control effect (d) across varying numbers of examples (0–200). Each graph corresponds to a **target axis** and shows the effect of perturbing other **affected axes**. Key elements:
### Graph Structure
- **X-axis**: `# Examples` (0–200)
- **Y-axis**: `Control effect (d)` (range: -0.2 to 0.2)
- **Lines**:
- Red dotted line labeled `LR` (baseline)
- Colored dashed lines for affected axes (PC1–PC512), matching legend colors
### Legend (Affected Axes)
| Color | Label |
|-------------|---------|
| Red | LR |
| Yellow | PC1 |
| Green | PC2 |
| Teal | PC4 |
| Blue | PC8 |
| Dark Blue | PC32 |
| Purple | PC128 |
| Dark Purple | PC512 |
### Graph-Specific Observations
1. **Target Axis: LR**
- All affected axes (PC1–PC512) show near-zero control effect (flat lines at ~0.0).
- Example: PC1 (yellow) and PC512 (dark purple) lines overlap with LR.
2. **Target Axis: PC1**
- PC1 (yellow) line shows slight deviation from LR (~0.01–0.02).
- Other axes (PC2–PC512) remain near zero.
3. **Target Axis: PC2**
- PC2 (green) line deviates slightly (~0.01–0.02).
- PC1 (yellow) and PC4 (teal) show minor effects.
4. **Target Axis: PC4**
- PC4 (teal) line deviates minimally (~0.01).
- PC2 (green) and PC8 (blue) show negligible effects.
5. **Target Axis: PC8**
- PC8 (blue) line shows slight deviation (~0.01).
- PC4 (teal) and PC32 (dark blue) remain near zero.
6. **Target Axis: PC32**
- PC32 (dark blue) line deviates minimally (~0.01).
- PC8 (blue) and PC128 (purple) show near-zero effects.
7. **Target Axis: PC128**
- PC128 (purple) line shows slight deviation (~0.01).
- PC32 (dark blue) and PC512 (dark purple) remain near zero.
8. **Target Axis: PC512**
- PC512 (dark purple) line deviates minimally (~0.01).
- All other axes (PC1–PC128) show near-zero effects.
---
## Right Panel: Heatmap (Control Effect Matrix)
A 8x8 heatmap quantifies control effects between target and affected axes. Rows = target axes; columns = affected axes. Color scale: red (positive) to blue (negative), with values from -0.005 to 0.005.
### Heatmap Structure
| Target Axis | PC1 | PC2 | PC4 | PC8 | PC32 | PC128 | PC512 | LR |
|-------------|--------|--------|--------|--------|--------|--------|--------|--------|
| **LR** | 0.000 | -0.000 | -0.000 | -0.000 | -0.000 | -0.000 | -0.000 | 0.000 |
| **PC1** | 0.000 | -0.000 | -0.000 | -0.000 | -0.000 | -0.000 | -0.000 | 0.000 |
| **PC2** | 0.000 | 0.000 | -0.000 | -0.000 | -0.000 | -0.000 | -0.000 | 0.000 |
| **PC4** | 0.000 | 0.000 | 0.000 | -0.000 | -0.000 | -0.000 | -0.000 | 0.000 |
| **PC8** | 0.000 | -0.000 | 0.000 | 0.000 | -0.000 | -0.000 | -0.000 | 0.000 |
| **PC32** | 0.000 | 0.000 | 0.000 | -0.000 | 0.000 | -0.000 | -0.000 | 0.000 |
| **PC128** | 0.000 | 0.000 | 0.000 | 0.000 | 0.000 | 0.000 | -0.000 | 0.000 |
| **PC512** | 0.000 | 0.000 | 0.000 | 0.000 | 0.000 | 0.000 | 0.000 | -0.000 |
### Key Trends
- **Diagonal Dominance**: All diagonal entries (target = affected) show near-zero control effects.
- **Negative Off-Diagonal**: Most off-diagonal entries are negative (blue), indicating inhibitory control effects.
- **Magnitude**: Largest deviations occur in:
- PC512 (target) affecting PC1 (value: -0.01).
- PC128 (target) affecting PC512 (value: -0.01).
- PC32 (target) affecting PC128 (value: -0.01).
---
## Cross-Referenced Observations
1. **Legend Consistency**: Line colors in graphs match heatmap row/column labels (e.g., PC1 = yellow in graphs, PC1 = column header in heatmap).
2. **Heatmap vs. Graphs**:
- Graphs show qualitative trends (e.g., PC1 target axis shows slight deviation for PC1 affected axis).
- Heatmap quantifies these effects (e.g., PC1 target axis affecting PC1: 0.000, PC2: -0.000).
3. **LR Baseline**: All graphs show LR as a flat line, confirming it as a reference point for control effects.
---
## Conclusion
The analysis reveals minimal control effects across most axis pairs, with slight inhibitory effects (negative values) in specific off-diagonal interactions. The LR axis serves as a consistent baseline, with deviations observed only in targeted perturbations (e.g., PC512 affecting PC1).