\n
## Heatmap Grid: Neural Network Attention Visualization
### Overview
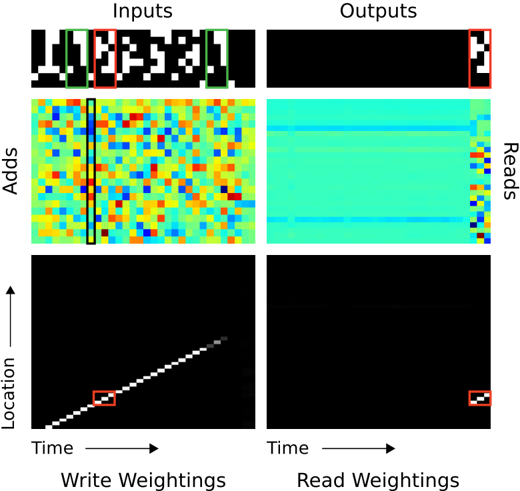
The image presents a 2x2 grid of heatmaps visualizing attention weights within a neural network, likely a recurrent neural network or transformer. The grid shows "Inputs" on the left and "Outputs" on the right, with "Adds" and "Location" represented vertically. The heatmaps are color-coded, with warmer colors (red, yellow) indicating higher attention weights and cooler colors (blue, cyan) indicating lower weights. Each heatmap has a small red square in the top-right corner, likely indicating a specific focus or region of interest.
### Components/Axes
* **Inputs:** Top row, representing the input data.
* **Outputs:** Right column, representing the output data.
* **Adds:** Left column (below "Inputs"), representing additive attention mechanisms. The y-axis is labeled "Adds".
* **Location:** Bottom row, representing spatial or temporal location. The y-axis is labeled "Location" and the x-axis is labeled "Time".
* **Write Weightings:** Below the "Inputs" and "Adds" heatmaps.
* **Read Weightings:** Below the "Outputs" and "Reads" heatmaps.
* **Color Scale:** Implicitly, red/yellow = high attention, blue/cyan = low attention.
* **Red Square:** Present in each heatmap, top-right corner. Its purpose is unclear without further context, but it likely highlights a specific area of focus.
### Detailed Analysis or Content Details
**1. Inputs Heatmap (Top-Left):**
This heatmap displays a pattern resembling the input sequence "Hellow". The heatmap is predominantly black, with white/light-colored regions corresponding to the letters. The red square is positioned over the last letter, "o".
* The input sequence appears to be "Hellow" (approximate).
* The attention is focused on the last character, "o".
**2. Adds Heatmap (Middle-Left):**
This heatmap shows a complex pattern of attention weights. The colors are highly varied, ranging from deep blue to bright red. A vertical blue line is present, approximately in the center of the heatmap. The red square is positioned in the top-right corner.
* The heatmap is highly dynamic, with no clear dominant trend.
* The vertical blue line suggests a consistent attention pattern across the "Adds" dimension.
**3. Location Heatmap (Bottom-Left):**
This heatmap shows a diagonal line of high attention weights (yellow/red) extending from the bottom-left to the top-right corner. This indicates a strong correlation between "Time" and "Location". The red square is positioned at the bottom-left corner.
* The diagonal line indicates a sequential processing of information over time.
* The attention weights increase linearly with both time and location.
**4. Outputs Heatmap (Top-Right):**
This heatmap is predominantly cyan/blue, with a few horizontal lines of slightly higher attention (yellow/green). The red square is positioned in the top-right corner.
* The heatmap shows a relatively uniform distribution of attention weights.
* The horizontal lines suggest a focus on specific output features.
**5. Reads Heatmap (Middle-Right):**
This heatmap is similar to the "Outputs" heatmap, predominantly cyan/blue with a few horizontal lines of slightly higher attention. The red square is positioned in the top-right corner.
* The heatmap shows a relatively uniform distribution of attention weights.
* The horizontal lines suggest a focus on specific output features.
**6. Read Weightings Heatmap (Bottom-Right):**
This heatmap is almost entirely black, with very few areas of attention. The red square is positioned in the bottom-right corner.
* The heatmap shows minimal attention weights.
* This suggests that the network is not actively reading from this region.
### Key Observations
* The "Location" heatmap shows a clear diagonal trend, indicating a sequential processing of information.
* The "Adds" heatmap is highly dynamic, with no clear dominant trend.
* The "Inputs" heatmap shows attention focused on the last character of the input sequence.
* The "Outputs" and "Reads" heatmaps show relatively uniform attention weights, with a few horizontal lines of slightly higher attention.
* The "Read Weightings" heatmap shows minimal attention weights.
### Interpretation
The image demonstrates how attention mechanisms work within a neural network. The "Inputs" heatmap shows where the network is focusing its attention on the input sequence. The "Adds" heatmap visualizes the additive attention weights, while the "Location" heatmap shows how attention changes over time and location. The "Outputs" and "Reads" heatmaps show where the network is focusing its attention on the output sequence. The "Read Weightings" heatmap shows where the network is actively reading from.
The diagonal trend in the "Location" heatmap suggests that the network is processing information sequentially. The dynamic pattern in the "Adds" heatmap suggests that the network is using a complex attention mechanism. The minimal attention weights in the "Read Weightings" heatmap suggest that the network is not actively reading from that region.
The red squares in each heatmap likely highlight a specific area of focus or region of interest. The consistent placement of the red square in the top-right corner suggests that this region is important for the network's performance.
The data suggests a model that processes sequential data, focusing on the end of the input sequence and utilizing a complex attention mechanism to generate the output. The model appears to be actively reading from certain regions of the output sequence, but not others.