## Line Chart: Gradient Variance vs. Epochs for MRL and SMRL
### Overview
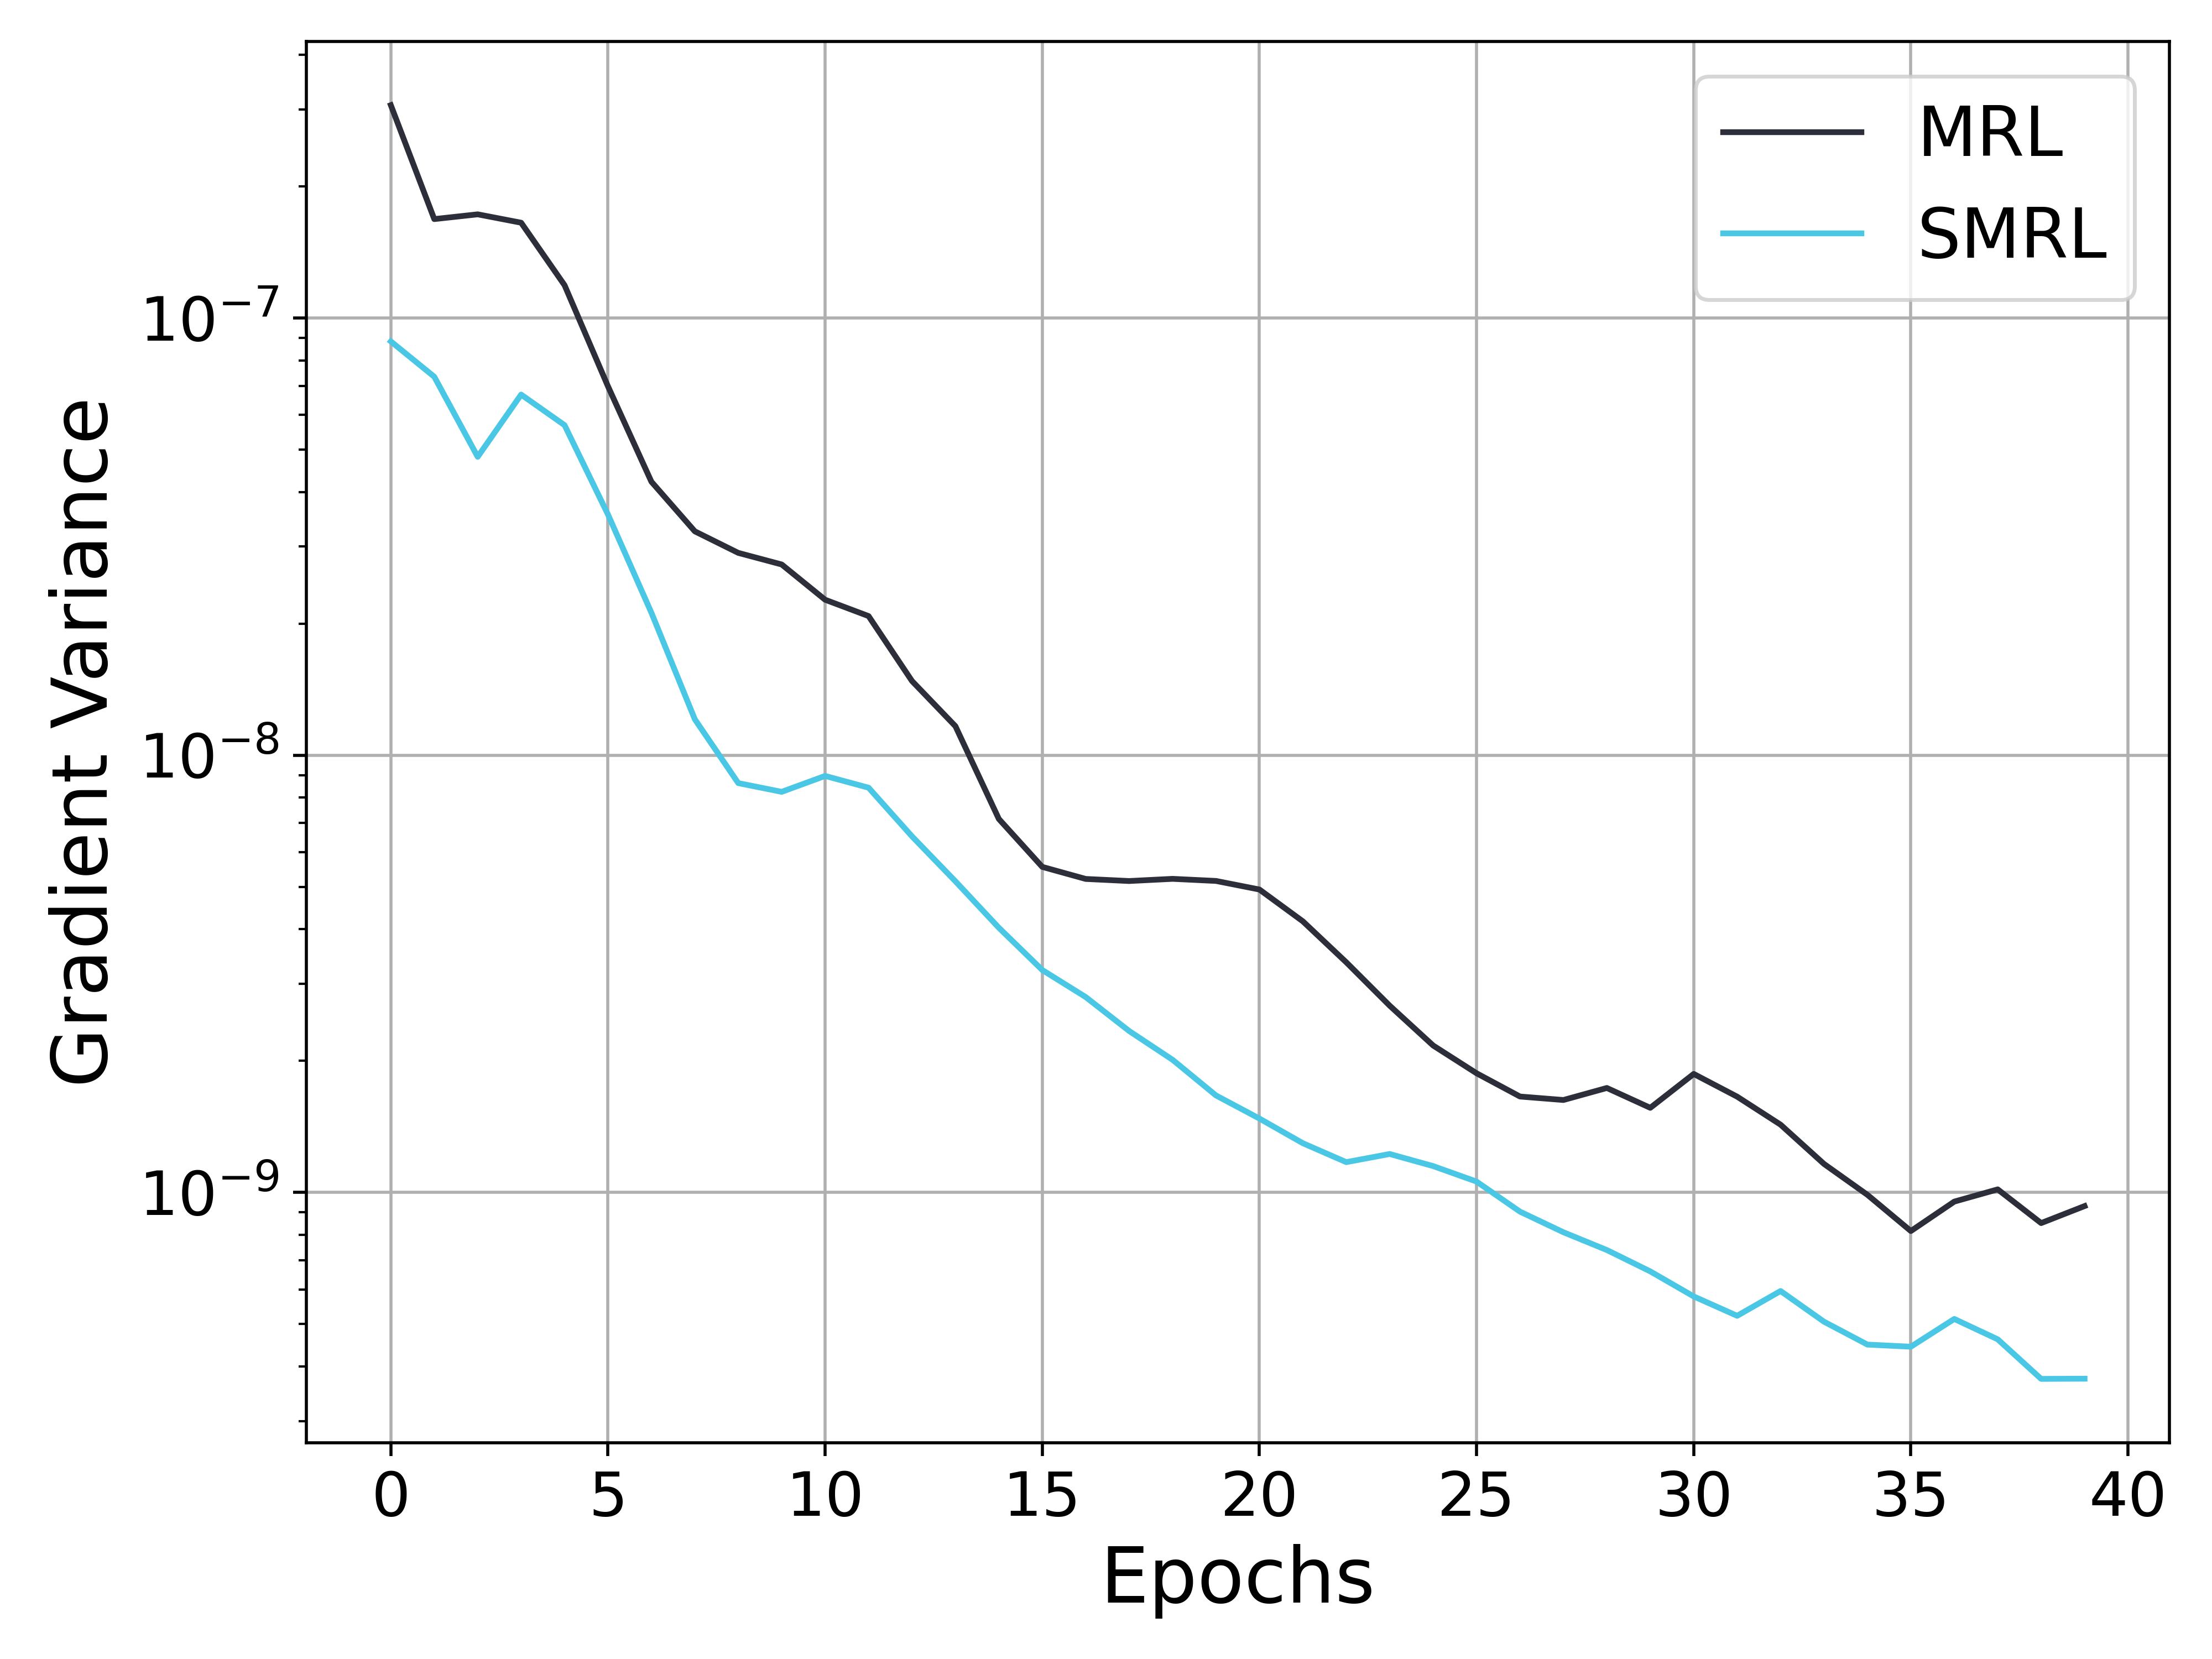
The image is a line chart comparing the gradient variance of two methods, MRL and SMRL, over 40 epochs. The y-axis represents gradient variance on a logarithmic scale, and the x-axis represents the number of epochs. Both MRL and SMRL show a decreasing trend in gradient variance as the number of epochs increases.
### Components/Axes
* **X-axis:** Epochs, with markers at 0, 5, 10, 15, 20, 25, 30, 35, and 40.
* **Y-axis:** Gradient Variance, with a logarithmic scale. Markers are at 10<sup>-7</sup>, 10<sup>-8</sup>, and 10<sup>-9</sup>.
* **Legend (Top-Right):**
* Black line: MRL
* Cyan line: SMRL
### Detailed Analysis
* **MRL (Black Line):**
* Trend: Decreasing gradient variance over epochs.
* At epoch 0, gradient variance is approximately 2.0 x 10<sup>-7</sup>.
* At epoch 10, gradient variance is approximately 3.0 x 10<sup>-8</sup>.
* At epoch 20, gradient variance is approximately 6.0 x 10<sup>-9</sup>.
* At epoch 30, gradient variance is approximately 1.5 x 10<sup>-9</sup>.
* At epoch 40, gradient variance is approximately 1.0 x 10<sup>-9</sup>.
* **SMRL (Cyan Line):**
* Trend: Decreasing gradient variance over epochs.
* At epoch 0, gradient variance is approximately 8.0 x 10<sup>-8</sup>.
* At epoch 10, gradient variance is approximately 8.0 x 10<sup>-9</sup>.
* At epoch 20, gradient variance is approximately 2.0 x 10<sup>-9</sup>.
* At epoch 30, gradient variance is approximately 6.0 x 10<sup>-10</sup>.
* At epoch 40, gradient variance is approximately 4.0 x 10<sup>-10</sup>.
### Key Observations
* Both MRL and SMRL show a significant decrease in gradient variance during the first 10 epochs.
* SMRL consistently has a lower gradient variance than MRL across all epochs.
* The rate of decrease in gradient variance slows down after 20 epochs for both methods.
* Both lines appear to flatten out towards the end of the training (epochs 30-40).
### Interpretation
The chart suggests that both MRL and SMRL converge as the number of training epochs increases, indicated by the decreasing gradient variance. SMRL appears to converge faster and achieve a lower gradient variance than MRL, suggesting it might be a more stable or efficient optimization method for this particular task. The flattening of the curves towards the end indicates that both methods are approaching a point where further training yields diminishing returns in terms of reducing gradient variance. The lower gradient variance of SMRL suggests it might generalize better or be less prone to overfitting compared to MRL.