\n
## Line Chart: Gradient Variance vs. Epochs
### Overview
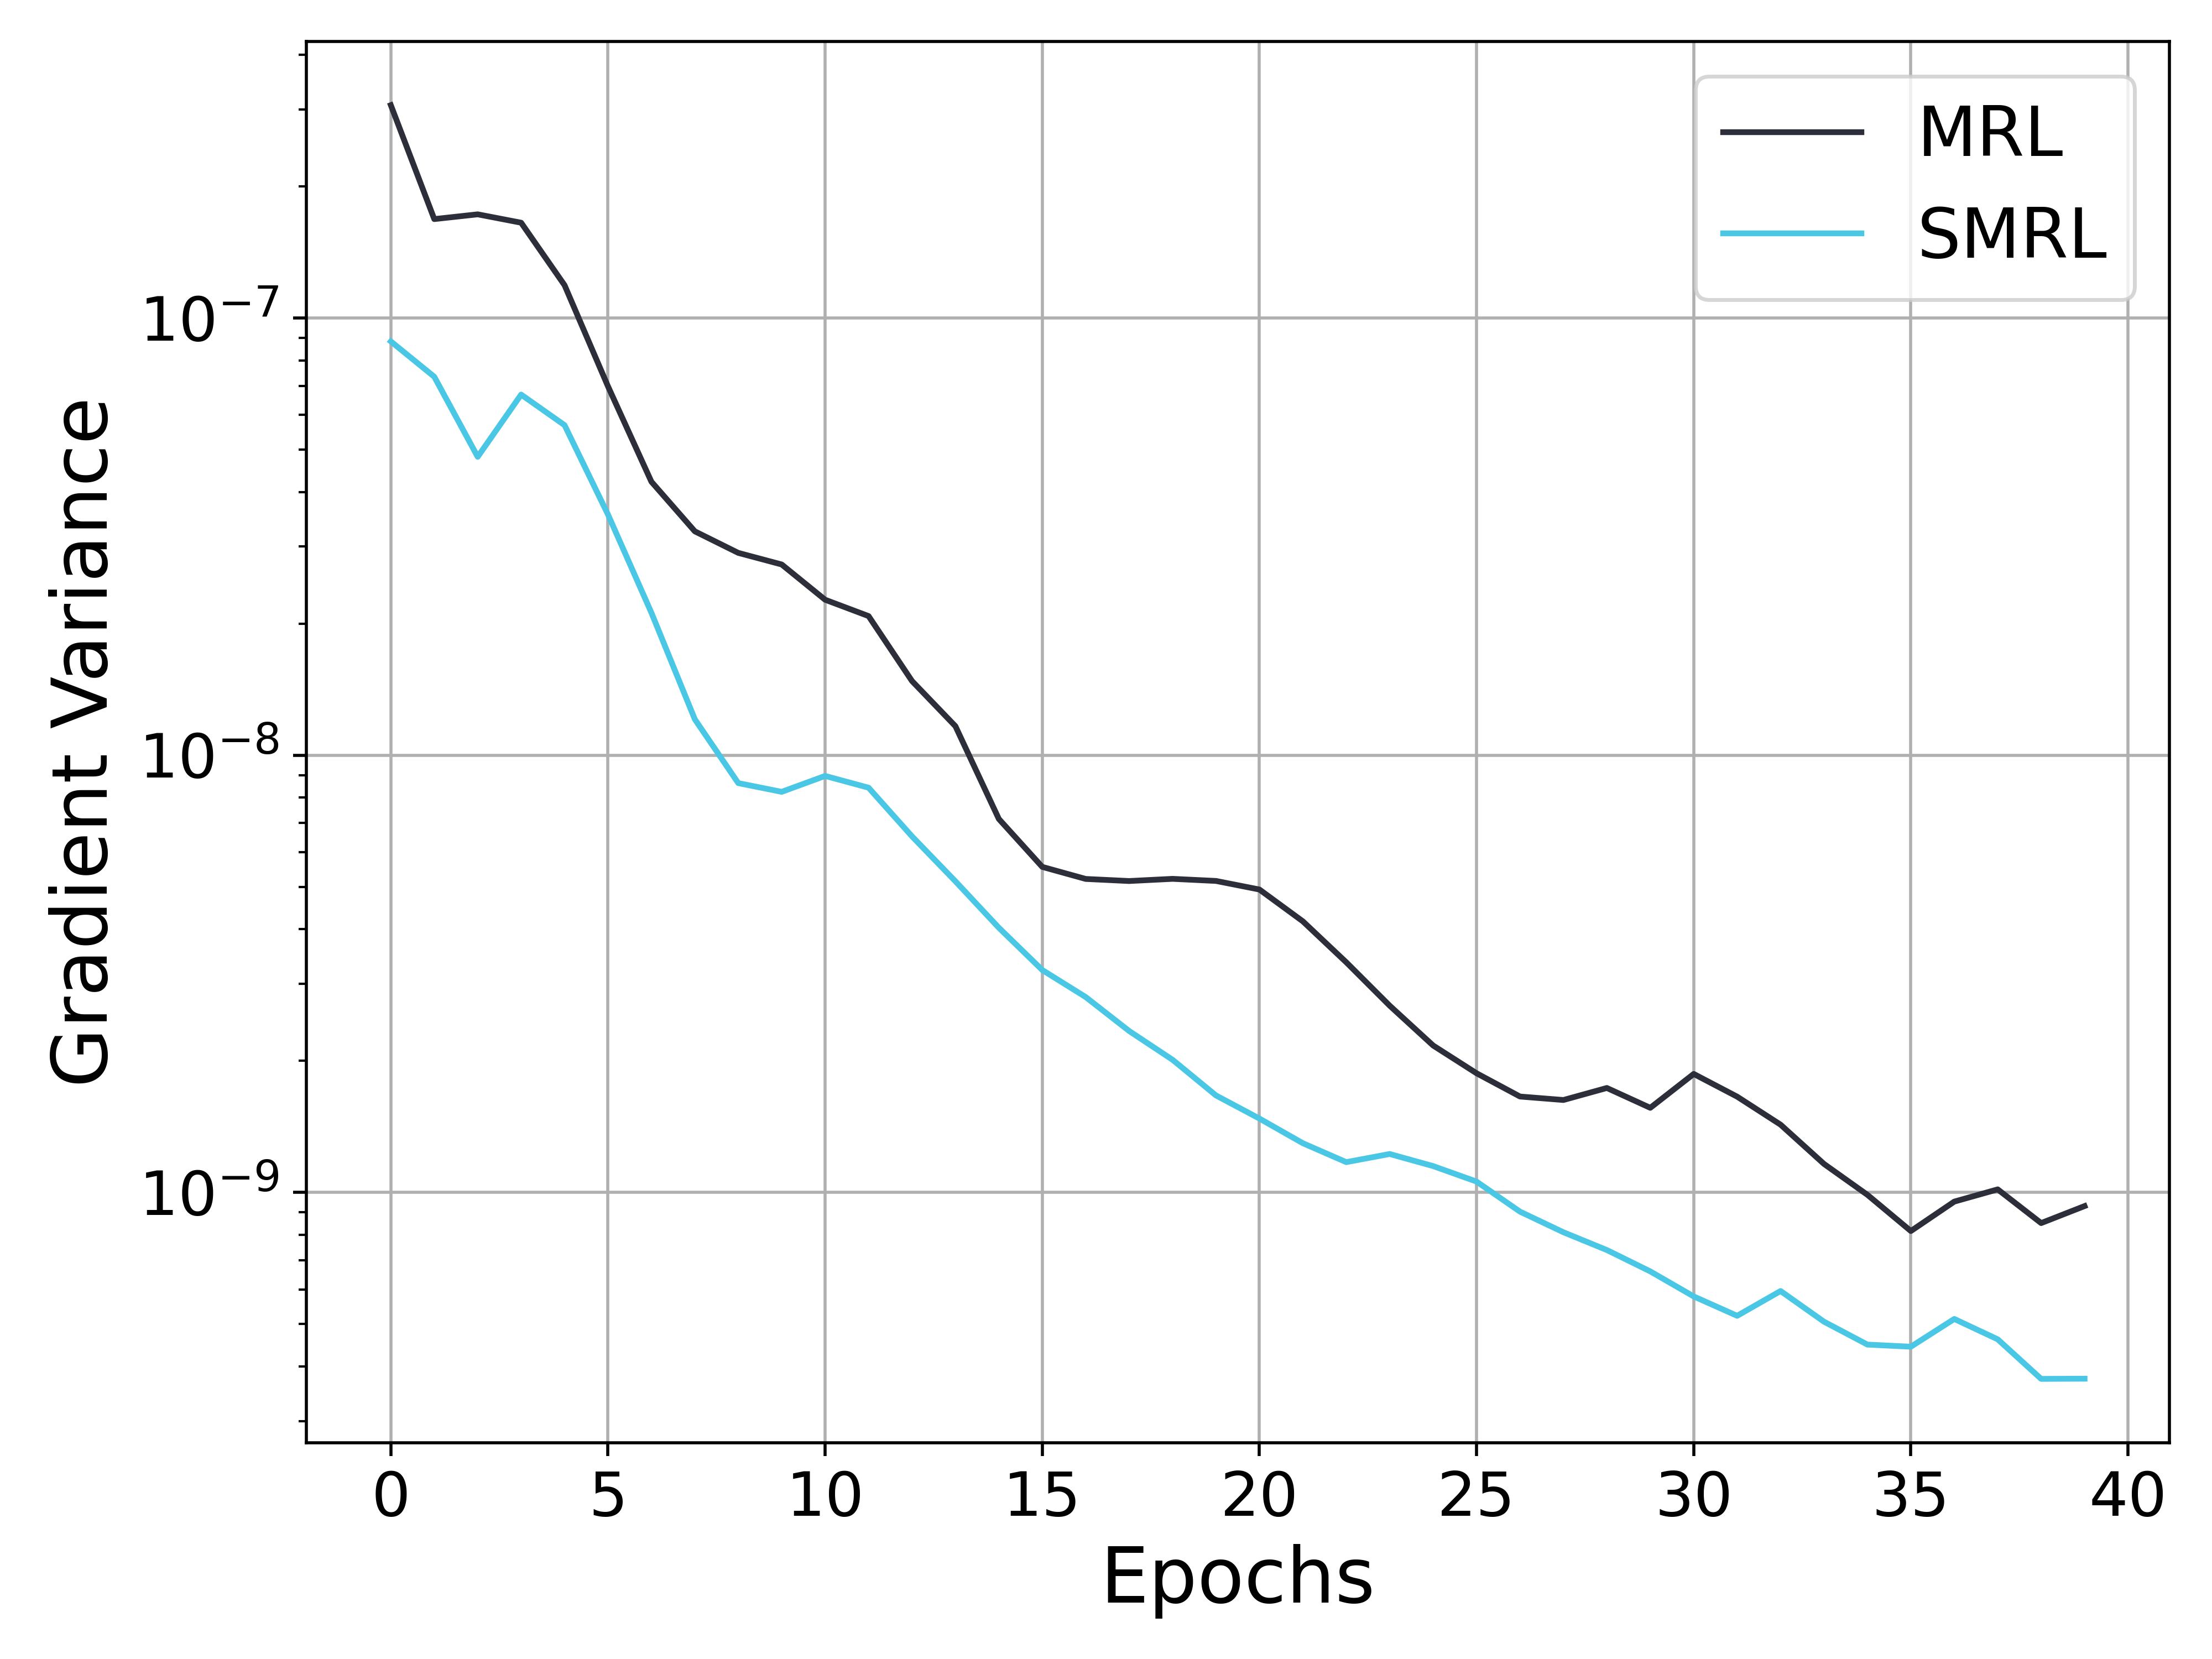
The image presents a line chart illustrating the relationship between Gradient Variance and Epochs for two different methods: MRL and SMRL. The chart displays how the gradient variance changes as the training progresses through epochs. The y-axis is on a logarithmic scale.
### Components/Axes
* **X-axis:** Epochs, ranging from 0 to 40.
* **Y-axis:** Gradient Variance, on a logarithmic scale from approximately 1e-7 to 1e-9.
* **Data Series 1:** MRL (black line)
* **Data Series 2:** SMRL (light blue line)
* **Legend:** Located in the top-right corner, labeling the two data series.
* **Grid:** A light gray grid is present in the background to aid in reading values.
### Detailed Analysis
**MRL (Black Line):**
The MRL line starts at approximately 1.1e-7 at Epoch 0. It initially decreases to around 8e-8 at Epoch 5, then continues to decrease, reaching a minimum of approximately 7e-9 at Epoch 25. After Epoch 25, the line exhibits a slight increase, fluctuating between 7e-9 and 9e-9 until Epoch 40, where it ends at approximately 8.5e-9.
**SMRL (Light Blue Line):**
The SMRL line begins at approximately 5e-7 at Epoch 0. It shows a rapid decrease initially, falling to around 2e-8 by Epoch 5. The line continues to descend, reaching a minimum of approximately 5e-9 at Epoch 30. From Epoch 30 to 40, the line fluctuates, ending at approximately 6e-9.
**Data Points (Approximate):**
| Epoch | MRL (Gradient Variance) | SMRL (Gradient Variance) |
|-------|--------------------------|---------------------------|
| 0 | 1.1e-7 | 5e-7 |
| 5 | 8e-8 | 2e-8 |
| 10 | 5e-8 | 1e-8 |
| 15 | 3e-8 | 7e-9 |
| 20 | 2e-8 | 6e-9 |
| 25 | 7e-9 | 5.5e-9 |
| 30 | 8e-9 | 5e-9 |
| 35 | 8.5e-9 | 6e-9 |
| 40 | 8.5e-9 | 6e-9 |
### Key Observations
* Both MRL and SMRL exhibit a decreasing trend in gradient variance as the number of epochs increases, indicating convergence during training.
* SMRL consistently demonstrates lower gradient variance compared to MRL across all epochs.
* The rate of decrease in gradient variance is steeper for SMRL, especially in the initial epochs.
* MRL shows a slight increase in gradient variance after Epoch 25, while SMRL remains relatively stable.
### Interpretation
The chart suggests that the SMRL method is more effective at reducing gradient variance during training compared to the MRL method. The lower gradient variance achieved by SMRL indicates a more stable and potentially faster convergence process. The initial rapid decrease in gradient variance for SMRL suggests that it quickly finds a good direction for parameter updates. The slight increase in gradient variance for MRL after Epoch 25 could indicate that the method is approaching a local minimum or experiencing oscillations. The logarithmic scale of the y-axis emphasizes the significant reduction in gradient variance achieved by both methods, but particularly by SMRL. This data likely represents the results of a machine learning training process, where the goal is to minimize the gradient variance to achieve optimal model performance.