## Scatter Plot: Relationship Between Stored Conductance (G₀) and Background Conductance (η_BG)
### Overview
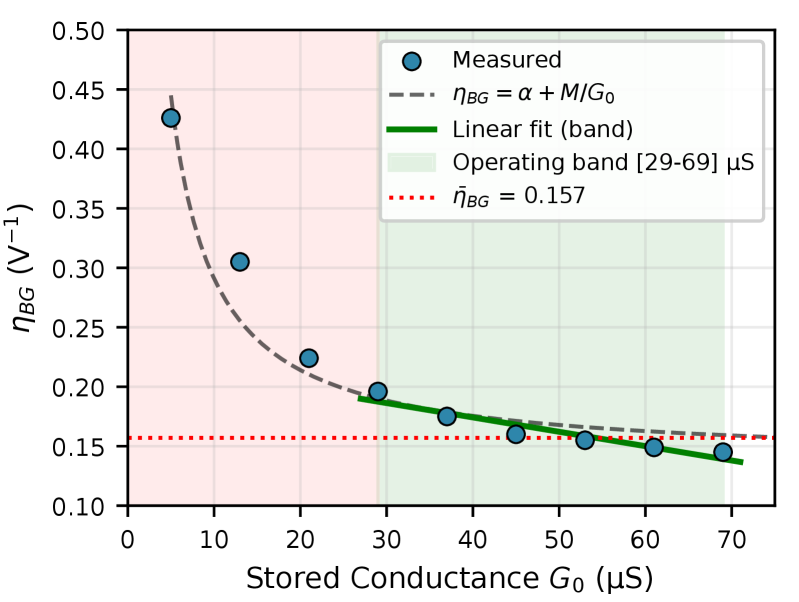
The image is a scatter plot showing the relationship between stored conductance (G₀, μS) and background conductance (η_BG, V⁻¹). It includes measured data points, fitted lines, and shaded regions representing operational parameters. The plot is divided into two regions: a pink shaded area (0–30 μS) and a green shaded area (29–69 μS), with the green region labeled as the "Operating band."
---
### Components/Axes
- **X-axis**: "Stored Conductance G₀ (μS)" with values ranging from 0 to 70 μS.
- **Y-axis**: "η_BG (V⁻¹)" with values ranging from 0.10 to 0.50 V⁻¹.
- **Legend**: Located in the top-right corner, with the following entries:
- **Blue circles**: "Measured" data points.
- **Dashed gray line**: "η_BG = α + M/G₀" (theoretical model).
- **Green solid line**: "Linear fit (band)".
- **Light green shaded area**: "Operating band [29–69] μS".
- **Red dotted line**: "η_BG = 0.157" (constant value).
---
### Detailed Analysis
#### Measured Data Points (Blue Circles)
- **Trend**: The measured data points show a decreasing trend as G₀ increases.
- **Key Values**:
- At G₀ = 5 μS: η_BG ≈ 0.43 V⁻¹.
- At G₀ = 20 μS: η_BG ≈ 0.22 V⁻¹.
- At G₀ = 30 μS: η_BG ≈ 0.19 V⁻¹.
- At G₀ = 50 μS: η_BG ≈ 0.16 V⁻¹.
- At G₀ = 70 μS: η_BG ≈ 0.14 V⁻¹.
#### Linear Fit (Green Solid Line)
- **Trend**: A linear decrease with a negative slope.
- **Key Values**:
- At G₀ = 30 μS: η_BG ≈ 0.20 V⁻¹.
- At G₀ = 70 μS: η_BG ≈ 0.14 V⁻¹.
#### Theoretical Model (Dashed Gray Line)
- **Equation**: η_BG = α + M/G₀.
- **Trend**: A decreasing curve with a steeper decline at lower G₀ values.
- **Key Values**:
- At G₀ = 0 μS: η_BG ≈ 0.45 V⁻¹.
- At G₀ = 70 μS: η_BG ≈ 0.15 V⁻¹.
#### Operating Band (Light Green Shaded Area)
- **Range**: G₀ = 29–69 μS.
- **Observation**: The measured data and fitted lines fall within this range for G₀ > 30 μS.
#### Red Dotted Line (η_BG = 0.157)
- **Trend**: A horizontal line at η_BG = 0.157 V⁻¹.
- **Observation**: The measured data and fitted lines approach this value as G₀ increases.
---
### Key Observations
1. **Decreasing Trend**: Both measured data and theoretical models show η_BG decreasing as G₀ increases.
2. **Operating Band**: The green shaded region (29–69 μS) aligns with the majority of the measured data points.
3. **Theoretical vs. Measured**: The dashed gray line (theoretical model) closely follows the measured data but with a slightly higher η_BG at lower G₀ values.
4. **Red Line Significance**: The red dotted line (η_BG = 0.157) acts as a reference threshold, with measured values approaching it at higher G₀.
---
### Interpretation
- **Data Relationship**: The plot demonstrates that increasing stored conductance (G₀) reduces background conductance (η_BG), consistent with the theoretical model η_BG = α + M/G₀.
- **Operational Relevance**: The green shaded "Operating band" (29–69 μS) suggests optimal performance or stability within this range.
- **Anomalies**: The measured data at G₀ = 5 μS (η_BG ≈ 0.43 V⁻¹) deviates significantly from the theoretical model (η_BG ≈ 0.45 V⁻¹), indicating potential experimental variability or unaccounted factors.
- **Threshold Behavior**: The red dotted line (η_BG = 0.157) may represent a critical threshold for device functionality, as measured values approach it at high G₀.
This analysis highlights the inverse relationship between stored conductance and background conductance, with the operating band and theoretical model providing context for device performance.