## Contour Plot: Density Distribution of Text Types
### Overview
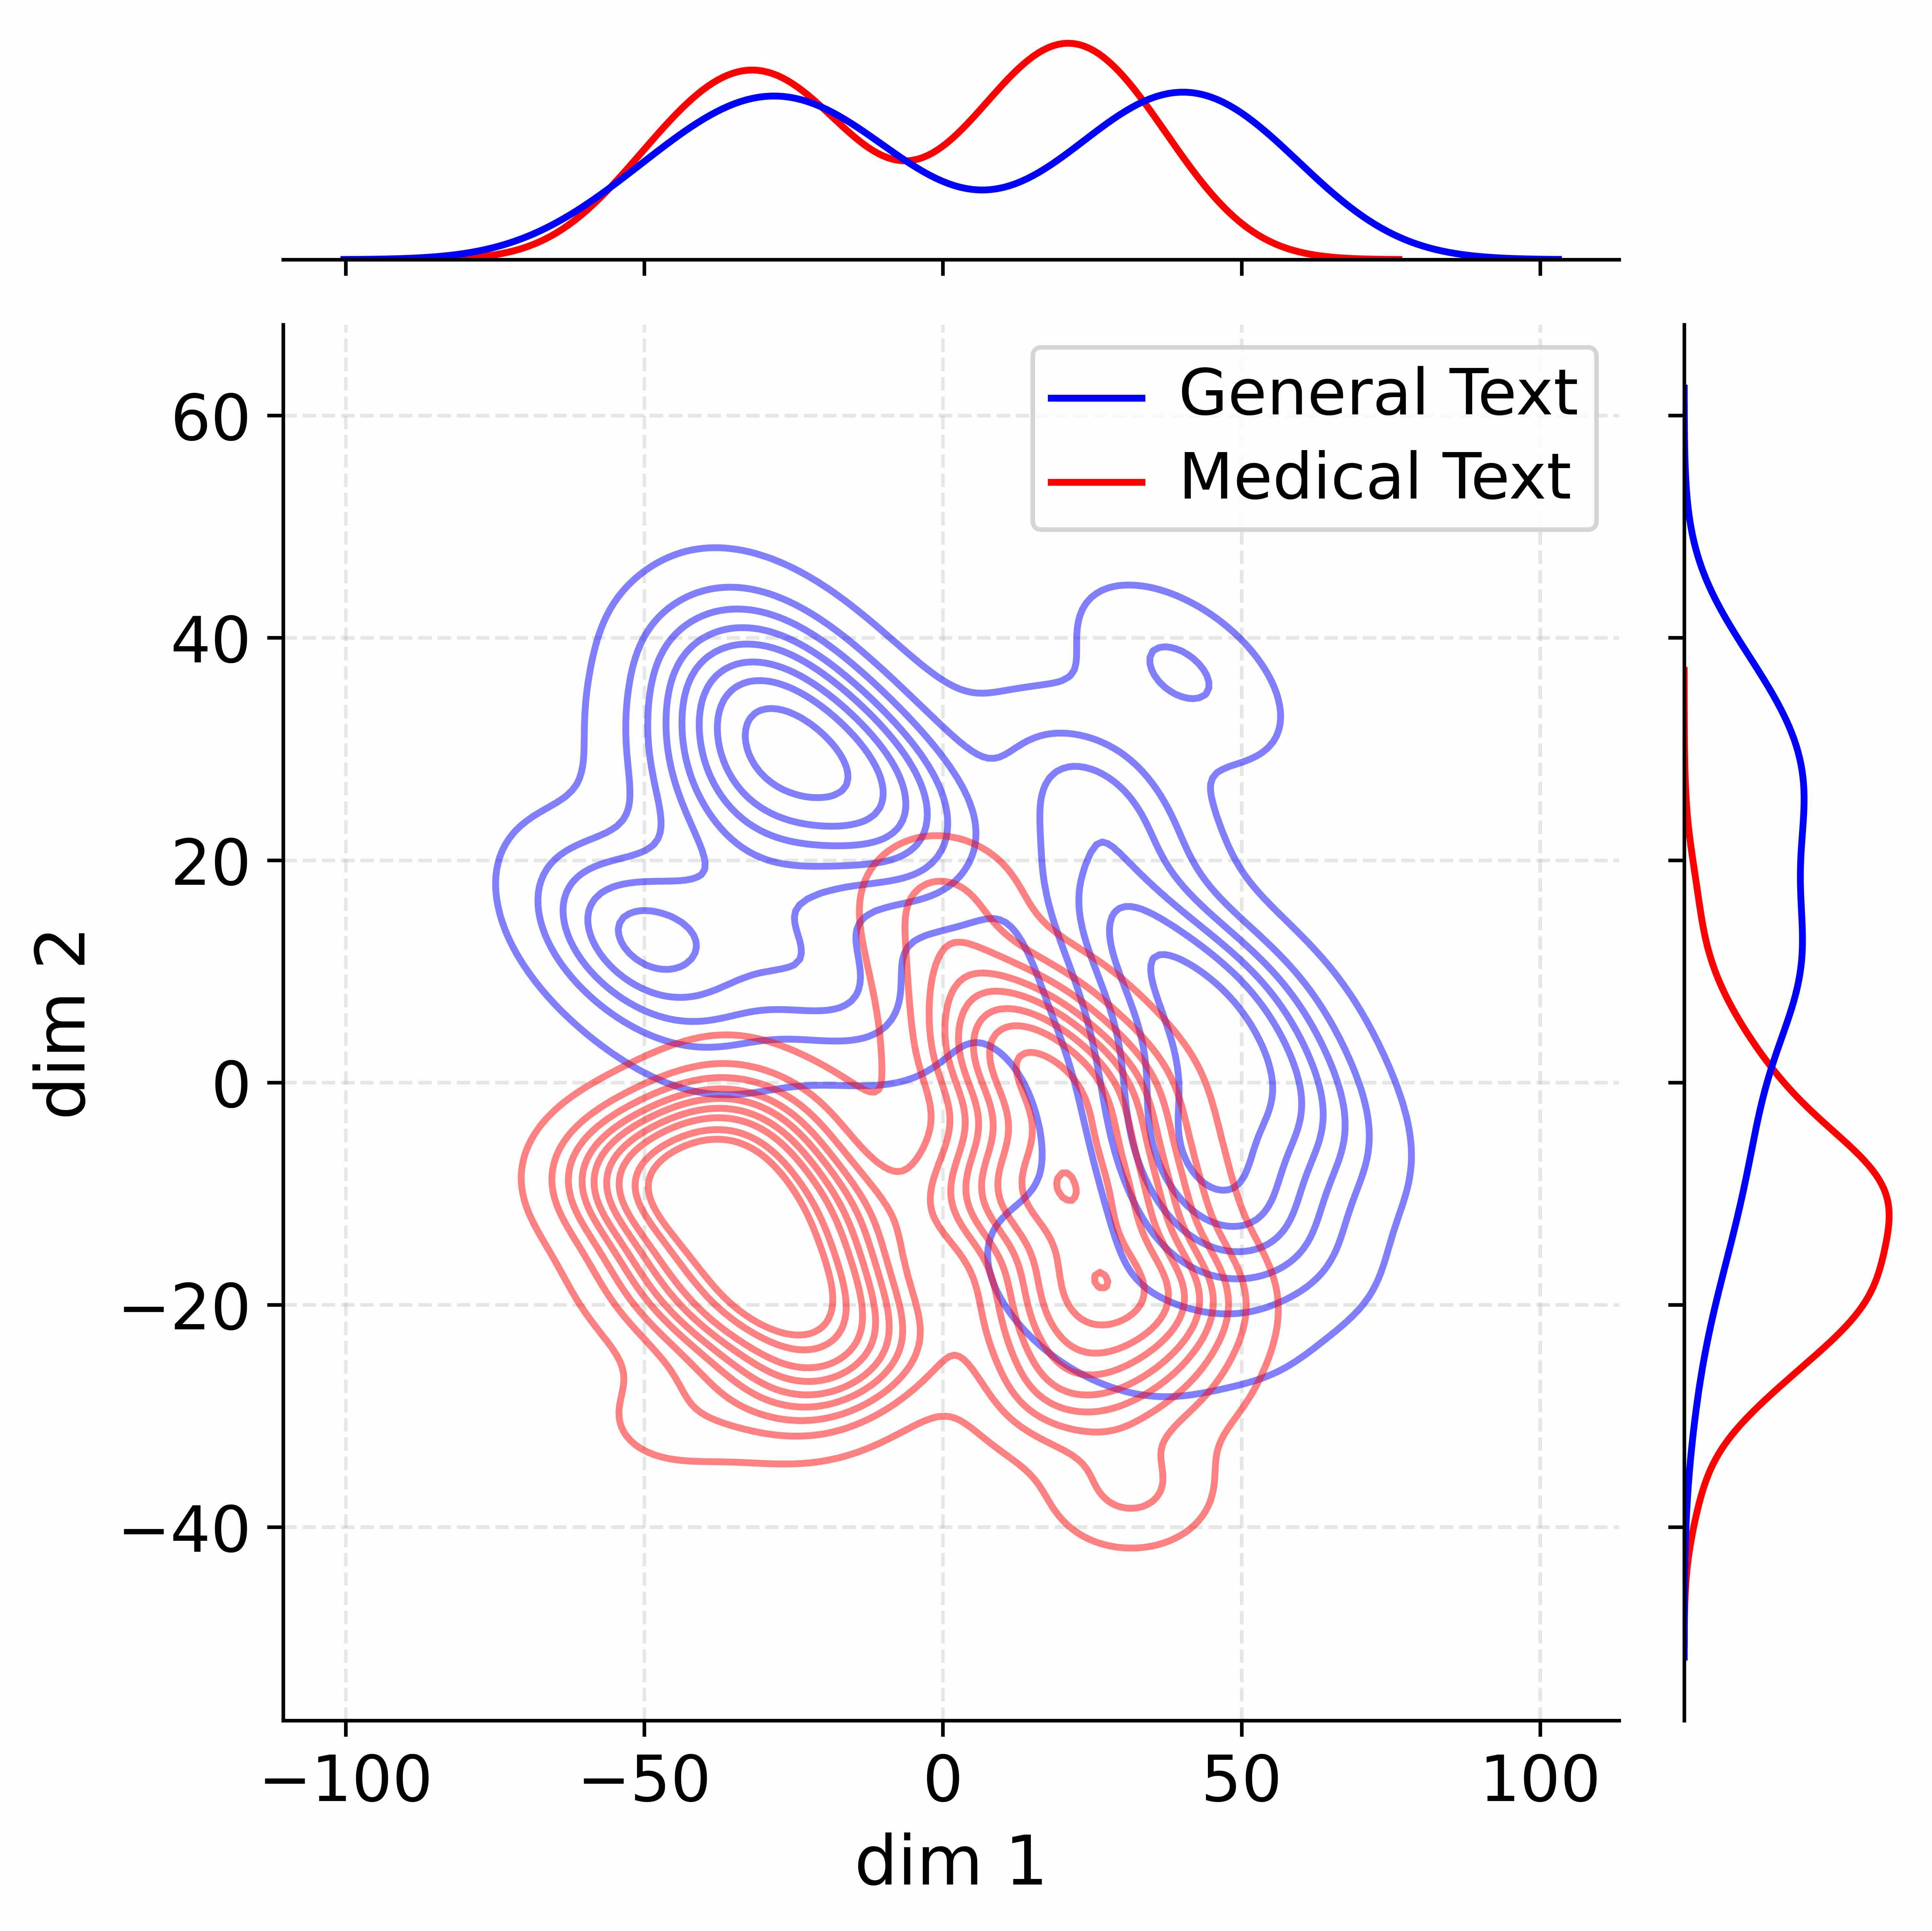
The image is a contour plot showing the density distribution of two types of text, "General Text" and "Medical Text", across two dimensions, "dim 1" and "dim 2". Marginal density plots are shown along the top and right axes.
### Components/Axes
* **Main Plot:** A 2D contour plot with "dim 1" on the x-axis and "dim 2" on the y-axis.
* X-axis ("dim 1"): Ranges from -100 to 100, with tick marks at -100, -50, 0, 50, and 100.
* Y-axis ("dim 2"): Ranges from -40 to 60, with tick marks at -40, -20, 0, 20, 40, and 60.
* Gridlines: Light gray dashed lines.
* **Top Marginal Plot:** A 1D density plot showing the distribution of "dim 1" for both text types.
* **Right Marginal Plot:** A 1D density plot showing the distribution of "dim 2" for both text types.
* **Legend:** Located in the top-center of the plot.
* "General Text": Represented by a blue line.
* "Medical Text": Represented by a red line.
### Detailed Analysis
* **General Text (Blue):**
* In the main plot, the blue contours indicate a higher density region centered approximately around dim1 = -30 and dim2 = 30. There's a secondary, less dense region around dim1 = 40 and dim2 = 20.
* Top marginal plot: The blue line shows two peaks, one around -30 and another around 40.
* Right marginal plot: The blue line shows a single peak around dim2 = 30.
* **Medical Text (Red):**
* In the main plot, the red contours indicate a higher density region centered approximately around dim1 = -20 and dim2 = -10.
* Top marginal plot: The red line shows a single peak around -20.
* Right marginal plot: The red line shows a single peak around dim2 = -10.
### Key Observations
* The "General Text" distribution is bimodal along "dim 1", suggesting two distinct clusters or sub-categories within the general text data.
* The "Medical Text" distribution is unimodal in both dimensions, indicating a more concentrated cluster.
* There is some overlap between the two distributions, particularly in the region around dim1 = -20 to 20 and dim2 = 0 to 20.
### Interpretation
The plot visualizes the distribution of "General Text" and "Medical Text" in a two-dimensional space defined by "dim 1" and "dim 2". The separation between the blue and red contours suggests that these two types of text occupy different regions in this space, implying that "dim 1" and "dim 2" are able to differentiate between them. The bimodal distribution of "General Text" along "dim 1" could indicate that this category is composed of two distinct sub-categories, while "Medical Text" appears to be more homogeneous. The overlap between the distributions suggests that there are some instances where the two types of text are similar or indistinguishable based on these two dimensions.