## 2D Kernel Density Estimate Plot with Marginal Distributions: General Text vs. Medical Text
### Overview
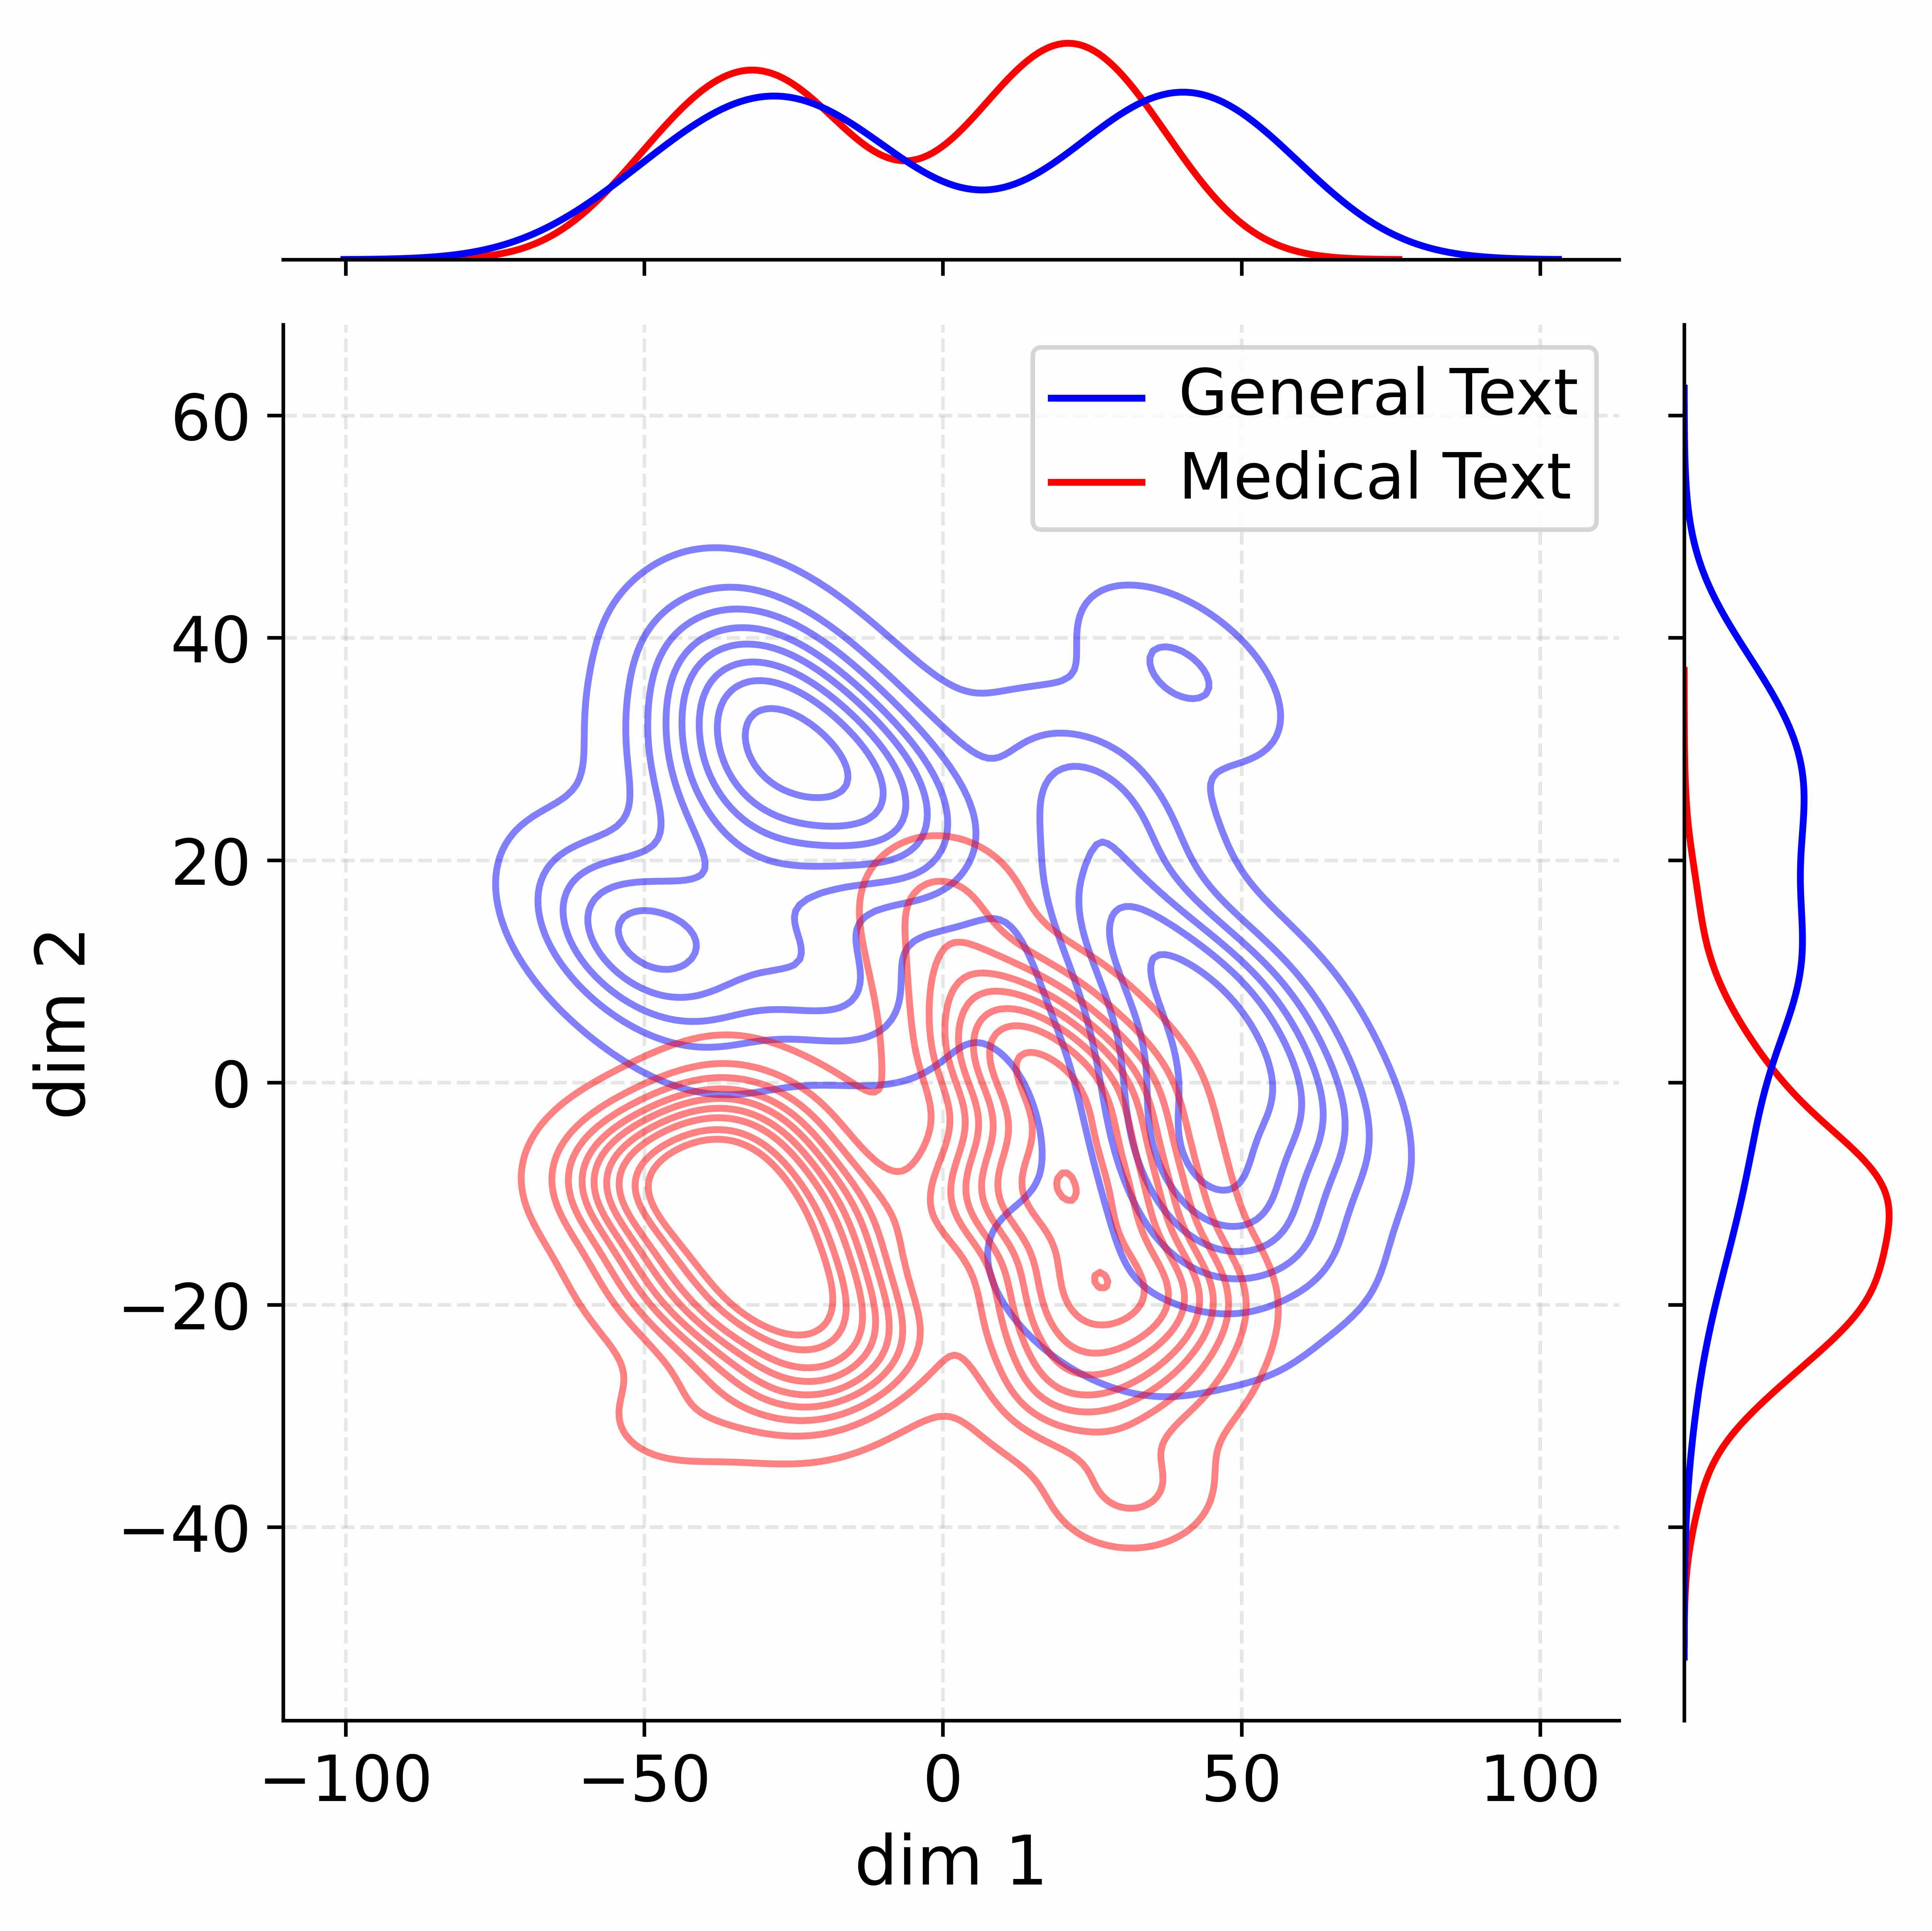
The image displays a 2D kernel density estimate (KDE) plot comparing the distribution of two datasets in a two-dimensional space. The central plot shows contour lines representing data density, with marginal density plots on the top and right axes showing the 1D distributions for each dimension separately. The data appears to be the result of a dimensionality reduction technique (e.g., PCA, t-SNE) applied to text data, projecting high-dimensional text embeddings into two dimensions (`dim 1` and `dim 2`).
### Components/Axes
* **Main Plot (Center):**
* **X-axis:** Labeled `dim 1`. Scale ranges from approximately -100 to 100, with major tick marks at -100, -50, 0, 50, and 100.
* **Y-axis:** Labeled `dim 2`. Scale ranges from approximately -40 to 60, with major tick marks at -40, -20, 0, 20, 40, and 60.
* **Data Series (Contour Lines):**
* **Blue Contours:** Represent the density of the "General Text" dataset.
* **Red Contours:** Represent the density of the "Medical Text" dataset.
* **Legend:** Located in the top-right quadrant of the main plot area. It contains two entries:
* A blue line labeled `General Text`.
* A red line labeled `Medical Text`.
* **Marginal Plot (Top):**
* Shows the 1D density distribution along the `dim 1` axis.
* Contains a blue line (General Text) and a red line (Medical Text).
* **Marginal Plot (Right):**
* Shows the 1D density distribution along the `dim 2` axis.
* Contains a blue line (General Text) and a red line (Medical Text).
### Detailed Analysis
**1. Main Contour Plot (dim 1 vs. dim 2):**
* **General Text (Blue):** Exhibits a **bimodal distribution** in the 2D space.
* **Cluster 1 (Upper-Left):** Centered approximately at `dim 1` = -30, `dim 2` = 30. This is a dense, tightly packed cluster.
* **Cluster 2 (Lower-Right):** Centered approximately at `dim 1` = 40, `dim 2` = -10. This cluster is more spread out and elongated vertically.
* The two clusters are connected by a region of lower density.
* **Medical Text (Red):** Exhibits a **unimodal, more concentrated distribution**.
* **Primary Cluster:** Centered approximately at `dim 1` = -10, `dim 2` = -15. The highest density core is very tight.
* The distribution has a tail extending towards positive `dim 1` values, overlapping with the lower-right cluster of the General Text.
* It shows very little presence in the upper-left region (`dim 2` > 20) where the first General Text cluster is located.
**2. Marginal Density Plots:**
* **Top Marginal (dim 1 Distribution):**
* **General Text (Blue):** Clearly **bimodal**. Peaks are at approximately `dim 1` = -30 and `dim 1` = 40. The valley between them is near `dim 1` = 5.
* **Medical Text (Red):** Appears **unimodal** with a single peak near `dim 1` = -10. The distribution is skewed to the right (positive direction).
* **Right Marginal (dim 2 Distribution):**
* **General Text (Blue):** Appears **bimodal**. Peaks are at approximately `dim 2` = 30 and `dim 2` = -10, corresponding to its two main clusters.
* **Medical Text (Red):** Appears **unimodal** with a single, sharp peak near `dim 2` = -15.
### Key Observations
1. **Clear Separation in `dim 2`:** The most significant separation between the two text types occurs along the `dim 2` axis. General Text has substantial density in the positive `dim 2` region (20 to 50), which is almost entirely absent in Medical Text.
2. **Overlap in Lower-Right Quadrant:** There is considerable spatial overlap between the lower-right cluster of General Text and the primary cluster of Medical Text, particularly in the region where `dim 1` is between 0 and 50 and `dim 2` is between -30 and 10.
3. **Distribution Shape:** General Text is characterized by two distinct modes/clusters, suggesting potential sub-categories or diverse topics within the general corpus. Medical Text is more homogeneous, clustering tightly around a central semantic region.
4. **Marginal Confirmation:** The 1D marginal plots perfectly corroborate the 2D contour observations, confirming the bimodal vs. unimodal nature of the distributions for each dimension.
### Interpretation
This visualization strongly suggests that **"General Text" and "Medical Text" occupy distinct, though partially overlapping, regions in the semantic embedding space**. The separation, especially along `dim 2`, indicates that the underlying language model or feature extraction method has captured fundamental differences in vocabulary, syntax, or context between general-domain and medical-domain text.
* **The bimodal nature of General Text** could reflect two broad sub-domains within the general corpus (e.g., narrative vs. informational text, or different topic clusters).
* **The tight, unimodal cluster of Medical Text** implies a more specialized and consistent lexicon and structure, centered around a core set of medical concepts.
* **The area of overlap** is particularly interesting. It likely represents text that uses common language or discusses topics where general and medical contexts intersect (e.g., public health announcements, patient-facing educational material, or news articles about medical research). This overlap region is a potential source of ambiguity for text classification systems.
From a practical standpoint, this analysis demonstrates that a classifier trained on these two dimensions could achieve high accuracy in distinguishing medical from general text, but would likely make errors primarily on documents falling within the overlapping region. The plot provides a visual justification for using such dimensionality-reduced features for domain-specific text classification tasks.