## Line Chart: Model Performance Comparison
### Overview
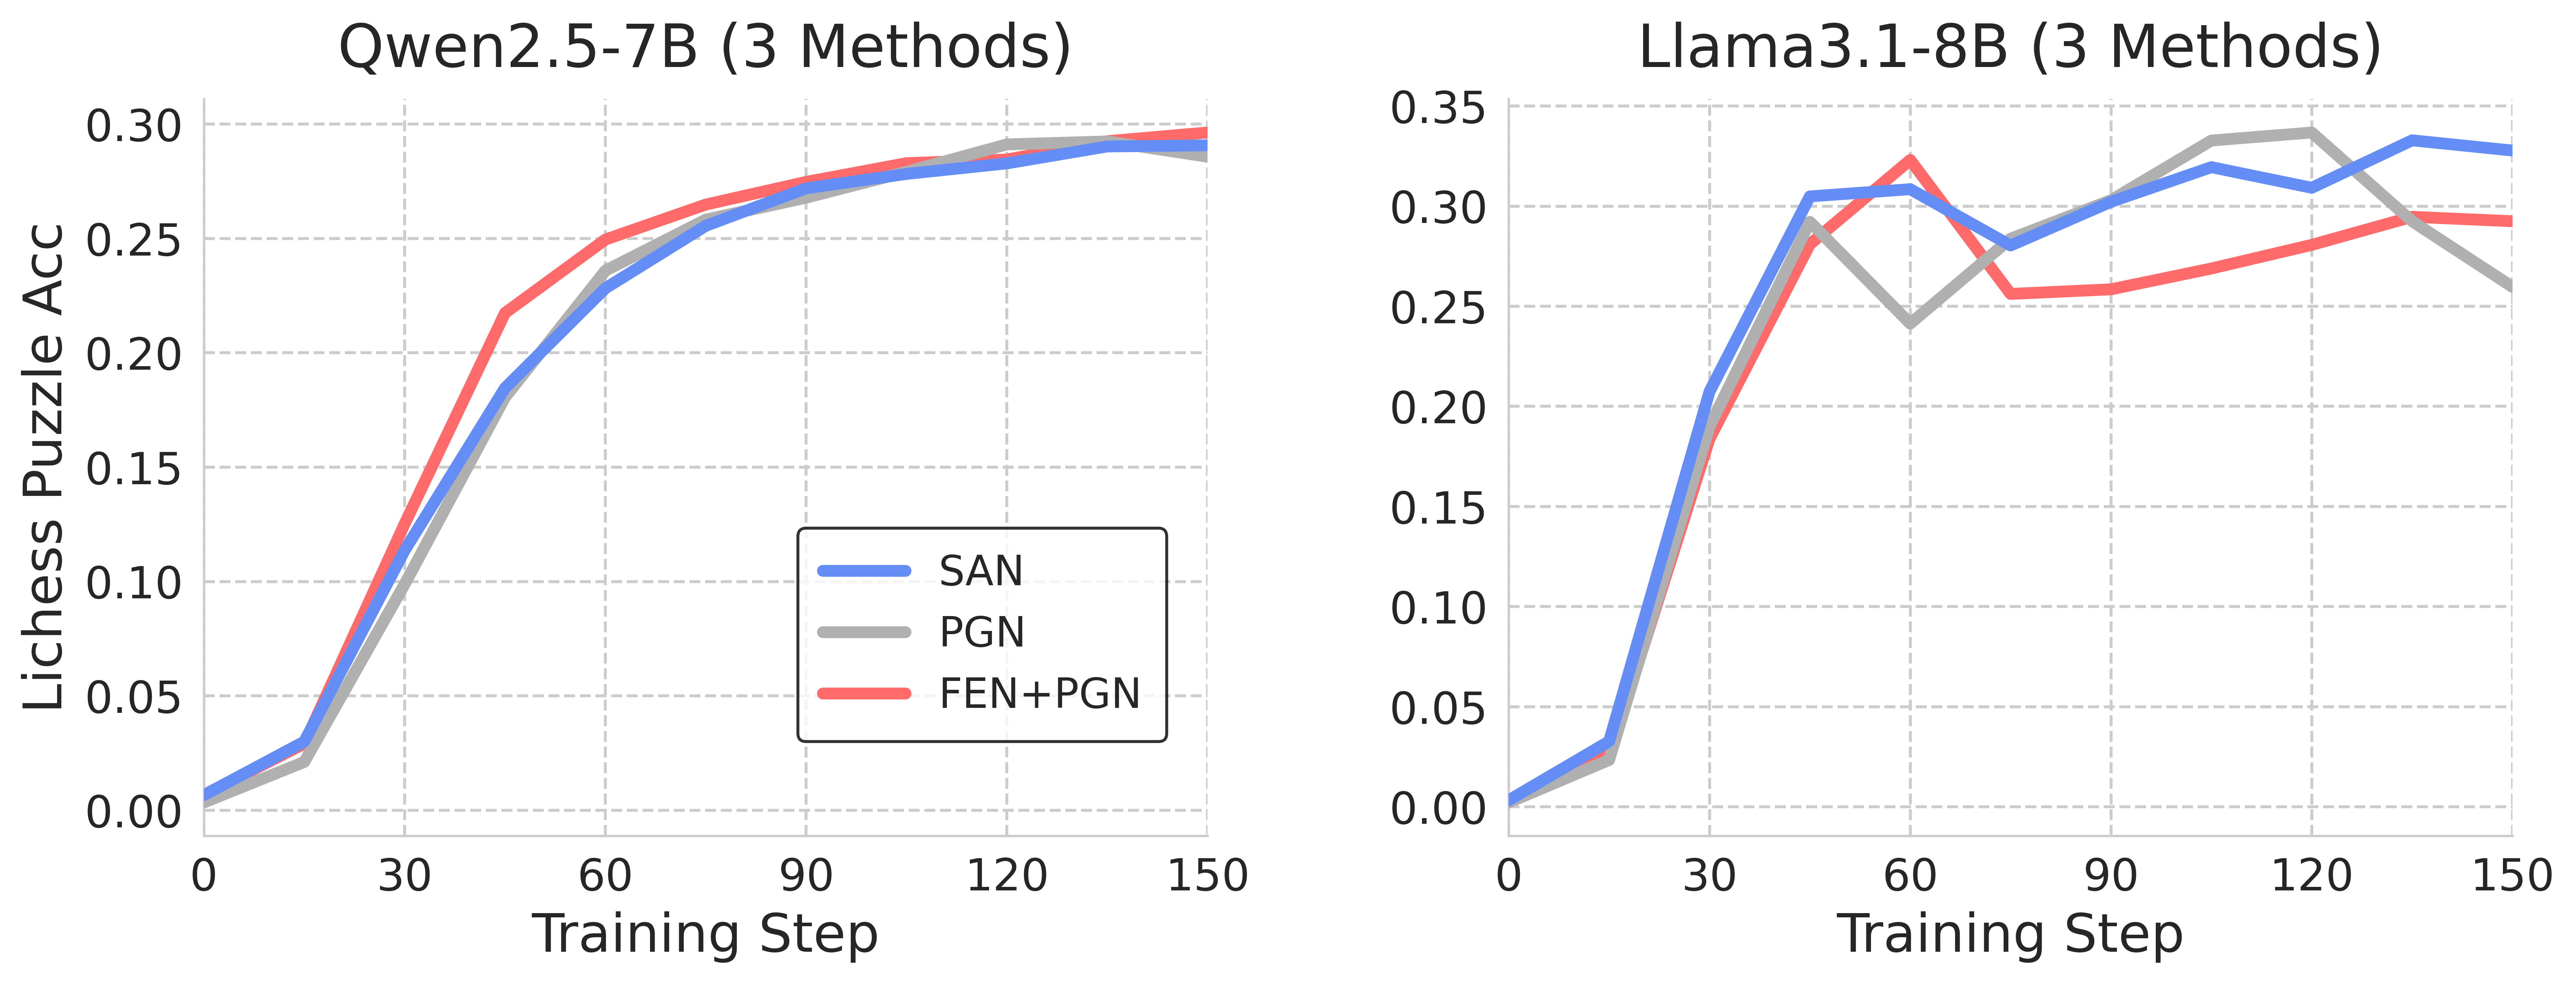
The image presents two line charts comparing the performance of different methods on two language models, Qwen2.5-7B and Llama3.1-8B. The charts display the Lichess Puzzle Accuracy against the Training Step for each method. The methods compared are SAN, PGN, and FEN+PGN.
### Components/Axes
* **Chart Titles:**
* Left Chart: Qwen2.5-7B (3 Methods)
* Right Chart: Llama3.1-8B (3 Methods)
* **X-Axis (Horizontal):** Training Step, with markers at 0, 30, 60, 90, 120, and 150.
* **Y-Axis (Vertical):** Lichess Puzzle Acc (Accuracy), with markers at 0.00, 0.05, 0.10, 0.15, 0.20, 0.25, 0.30 for the left chart, and 0.00, 0.05, 0.10, 0.15, 0.20, 0.25, 0.30, 0.35 for the right chart.
* **Legend:** Located in the center of the image, between the two charts.
* Blue Line: SAN
* Gray Line: PGN
* Red Line: FEN+PGN
### Detailed Analysis
#### Qwen2.5-7B (Left Chart)
* **SAN (Blue):** The line starts at approximately 0.01 at Training Step 0, rises sharply to approximately 0.19 at Training Step 30, continues to rise to approximately 0.27 at Training Step 90, and plateaus around 0.29-0.30 at Training Step 150.
* **PGN (Gray):** The line starts at approximately 0.01 at Training Step 0, rises sharply to approximately 0.20 at Training Step 30, continues to rise to approximately 0.28 at Training Step 90, and plateaus around 0.29 at Training Step 150.
* **FEN+PGN (Red):** The line starts at approximately 0.01 at Training Step 0, rises sharply to approximately 0.22 at Training Step 30, continues to rise to approximately 0.27 at Training Step 60, and plateaus around 0.29 at Training Step 150.
#### Llama3.1-8B (Right Chart)
* **SAN (Blue):** The line starts at approximately 0.01 at Training Step 0, rises sharply to approximately 0.30 at Training Step 30, dips to approximately 0.28 at Training Step 60, rises again to approximately 0.34 at Training Step 120, and ends at approximately 0.33 at Training Step 150.
* **PGN (Gray):** The line starts at approximately 0.01 at Training Step 0, rises sharply to approximately 0.24 at Training Step 30, rises again to approximately 0.32 at Training Step 90, dips to approximately 0.26 at Training Step 150.
* **FEN+PGN (Red):** The line starts at approximately 0.01 at Training Step 0, rises sharply to approximately 0.32 at Training Step 30, dips to approximately 0.26 at Training Step 60, rises again to approximately 0.29 at Training Step 150.
### Key Observations
* For Qwen2.5-7B, all three methods (SAN, PGN, and FEN+PGN) show similar performance, converging to approximately the same accuracy level after 90 training steps.
* For Llama3.1-8B, SAN generally outperforms PGN and FEN+PGN, achieving higher accuracy levels, especially after 90 training steps.
* Llama3.1-8B shows more fluctuation in accuracy during training compared to Qwen2.5-7B.
### Interpretation
The data suggests that for the Qwen2.5-7B model, the choice of method (SAN, PGN, or FEN+PGN) has a minimal impact on the final Lichess Puzzle Accuracy. All three methods converge to similar performance levels. However, for the Llama3.1-8B model, the SAN method appears to be more effective, achieving higher accuracy compared to PGN and FEN+PGN. The fluctuations in accuracy for Llama3.1-8B indicate that this model might be more sensitive to the training process or require more fine-tuning. The similar starting points for all methods suggest that the initial state of the models is consistent before training begins.