## Line Graphs: Lichess Puzzle Accuracy vs Training Steps for Qwen2.5-7B and Llama3.1-8B Models
### Overview
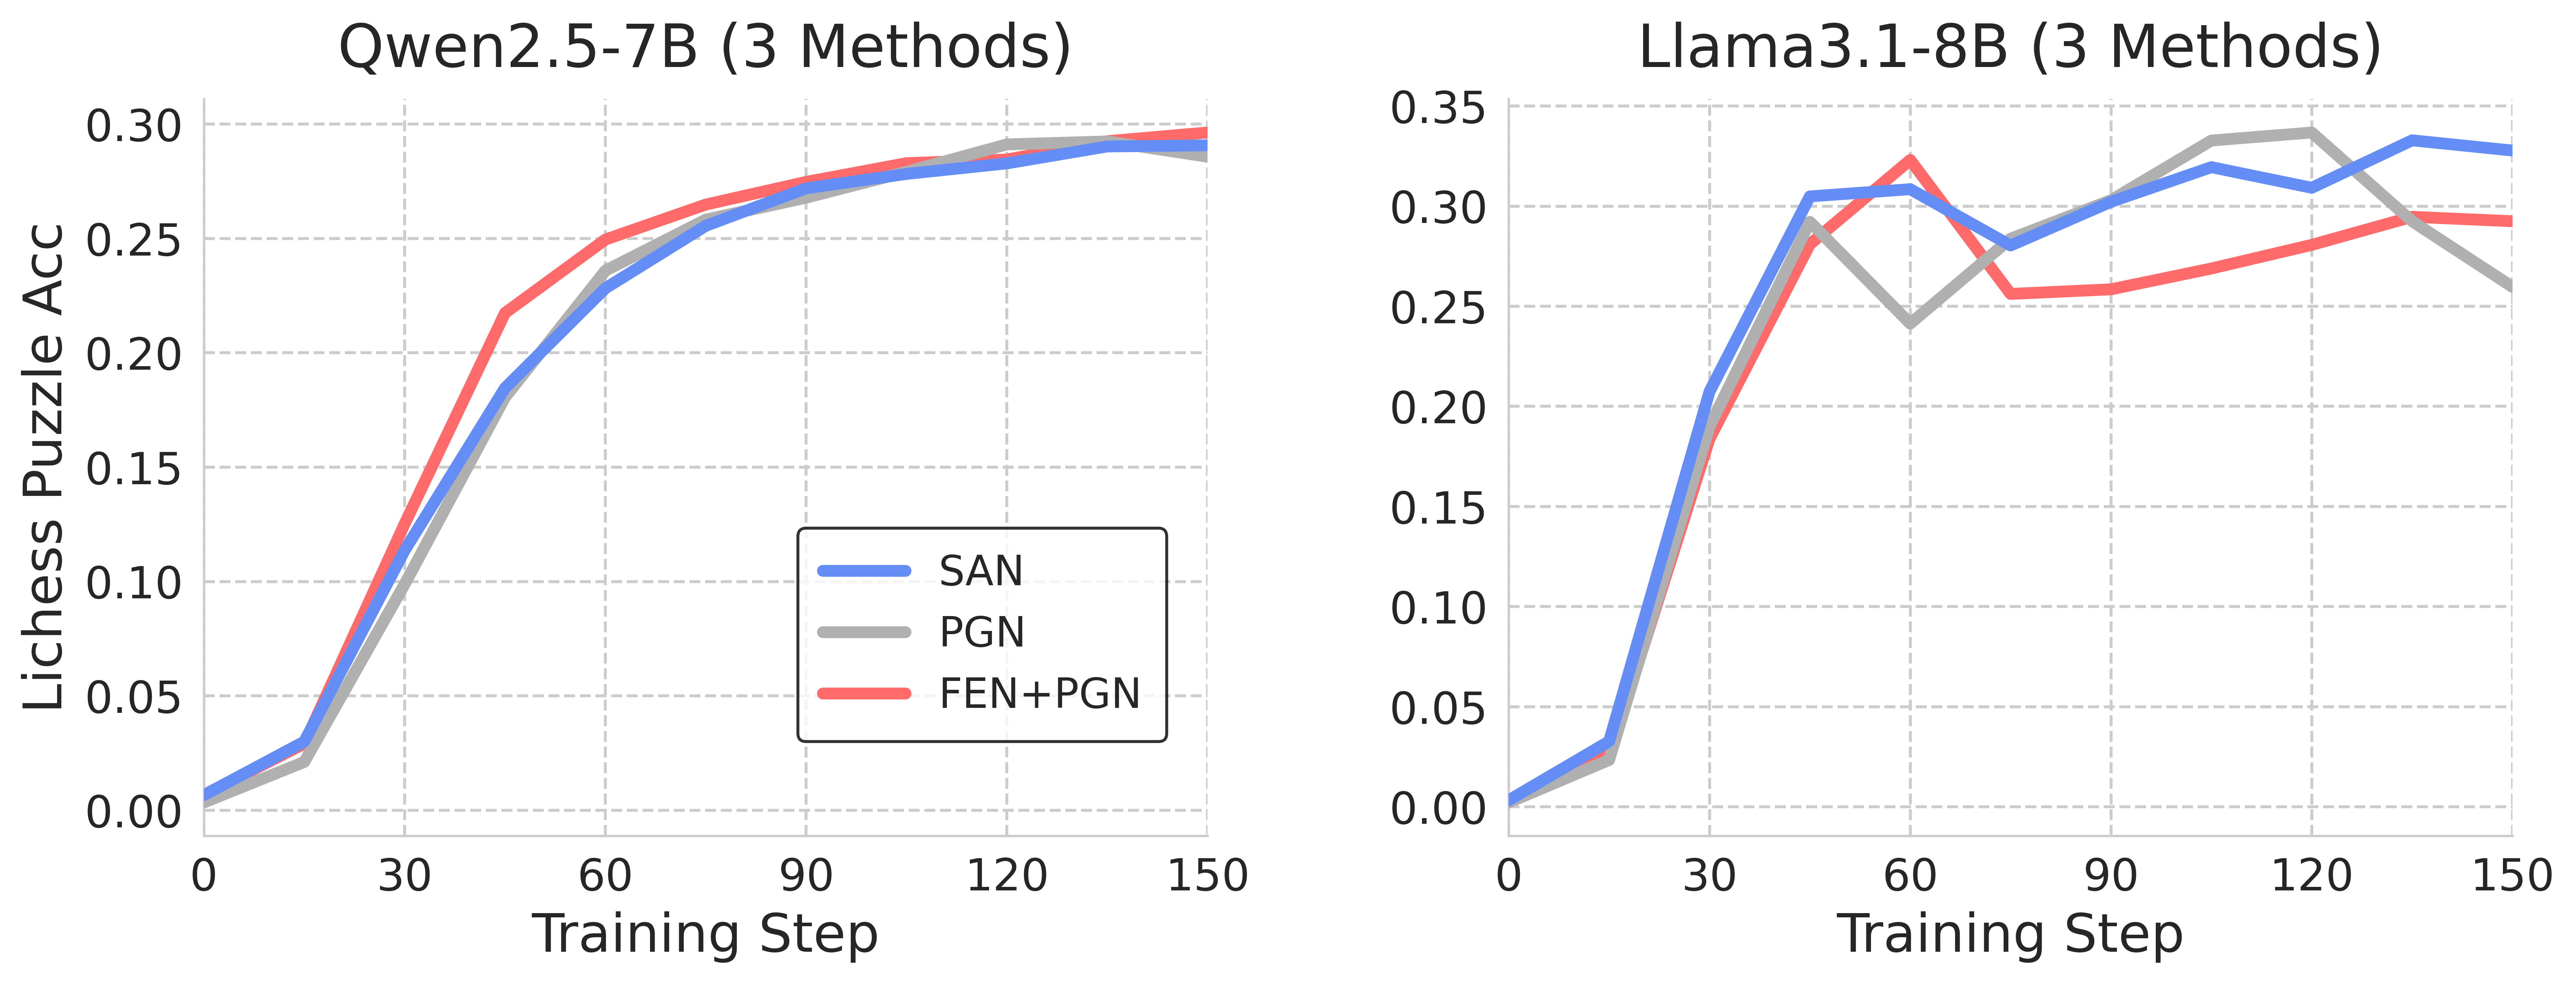
The image contains two line graphs comparing the performance of three methods (SAN, PGN, FEN+PGN) across two language models (Qwen2.5-7B and Llama3.1-8B) over 150 training steps. The y-axis measures Lichess Puzzle Accuracy (0-0.35), and the x-axis represents training steps (0-150). Each graph uses distinct color coding for methods: blue (SAN), gray (PGN), and red (FEN+PGN).
### Components/Axes
- **Left Graph (Qwen2.5-7B)**:
- **X-axis**: Training Step (0-150, linear scale)
- **Y-axis**: Lichess Puzzle Accuracy (0-0.30, linear scale)
- **Legend**: Bottom-left corner (blue=SAN, gray=PGN, red=FEN+PGN)
- **Right Graph (Llama3.1-8B)**:
- **X-axis**: Training Step (0-150, linear scale)
- **Y-axis**: Lichess Puzzle Accuracy (0-0.35, linear scale)
- **Legend**: Top-right corner (blue=SAN, gray=PGN, red=FEN+PGN)
### Detailed Analysis
#### Qwen2.5-7B Graph
- **SAN (blue)**:
- Starts at ~0.01 (step 0), rises sharply to ~0.29 (step 150).
- Steady upward trend with minimal fluctuations.
- **PGN (gray)**:
- Begins at ~0.02 (step 0), peaks at ~0.28 (step 150).
- Slight dip at step 60 (~0.24) before recovery.
- **FEN+PGN (red)**:
- Starts at ~0.01 (step 0), reaches ~0.30 (step 150).
- Consistent growth with minor plateaus.
#### Llama3.1-8B Graph
- **SAN (blue)**:
- Begins at ~0.01 (step 0), surges to ~0.34 (step 150).
- Sharp rise at step 30 (~0.25), with minor dips at steps 60 (~0.28) and 90 (~0.30).
- **PGN (gray)**:
- Starts at ~0.02 (step 0), peaks at ~0.32 (step 120), then drops to ~0.26 (step 150).
- Volatile trend with a significant dip at step 60 (~0.25).
- **FEN+PGN (red)**:
- Begins at ~0.01 (step 0), stabilizes at ~0.30 (step 150).
- Peaks at ~0.33 (step 60), followed by gradual decline.
### Key Observations
1. **Performance Trends**:
- SAN consistently outperforms other methods in Llama3.1-8B, especially after step 30.
- PGN shows instability in Llama3.1-8B, with a notable drop after step 120.
- FEN+PGN maintains steady performance across both models but rarely leads.
2. **Model-Specific Behavior**:
- Qwen2.5-7B exhibits smoother convergence for all methods.
- Llama3.1-8B shows higher volatility, particularly for PGN.
3. **Method Comparison**:
- SAN achieves the highest accuracy in Llama3.1-8B (0.34 vs. 0.30 for FEN+PGN).
- PGN underperforms in Llama3.1-8B despite strong initial growth.
### Interpretation
The data suggests that **SAN** is the most effective method for Llama3.1-8B, likely due to its rapid adaptation to the model's complexity. PGN's volatility in Llama3.1-8B may indicate overfitting or sensitivity to training dynamics. FEN+PGN's consistency across models highlights its reliability but limited peak performance. For Qwen2.5-7B, all methods converge closely, suggesting the model's architecture may inherently limit method differentiation. The stark contrast between Llama3.1-8B and Qwen2.5-7B performance underscores the importance of method-model compatibility in training strategies.