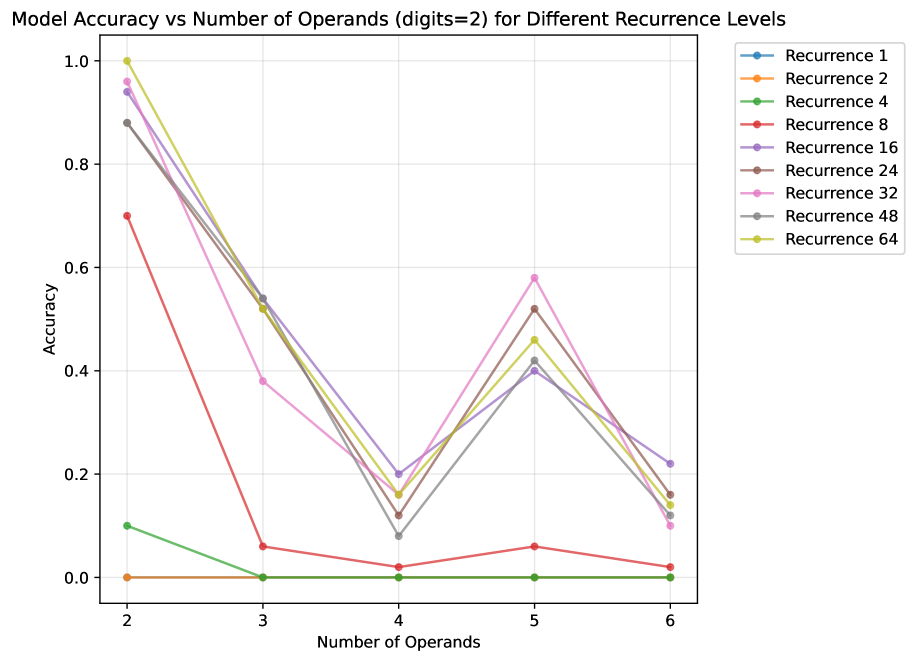
## Chart: Model Accuracy vs Number of Operands for Different Recurrence Levels
### Overview
The image is a line chart that displays the model accuracy versus the number of operands (digits=2) for different recurrence levels. The x-axis represents the number of operands, ranging from 2 to 6. The y-axis represents the accuracy, ranging from 0.0 to 1.0. There are nine different recurrence levels plotted on the chart, each represented by a different colored line.
### Components/Axes
* **Title:** Model Accuracy vs Number of Operands (digits=2) for Different Recurrence Levels
* **X-axis:** Number of Operands (values: 2, 3, 4, 5, 6)
* **Y-axis:** Accuracy (values: 0.0, 0.2, 0.4, 0.6, 0.8, 1.0)
* **Legend:** Located on the top-right of the chart.
* Recurrence 1 (blue)
* Recurrence 2 (orange)
* Recurrence 4 (green)
* Recurrence 8 (red)
* Recurrence 16 (purple)
* Recurrence 24 (brown)
* Recurrence 32 (pink)
* Recurrence 48 (gray)
* Recurrence 64 (yellow)
### Detailed Analysis
Here's a breakdown of each recurrence level's trend and approximate data points:
* **Recurrence 1 (blue):** Generally decreasing trend.
* (2, 0.90)
* (3, 0.55)
* (4, 0.20)
* (5, 0.40)
* (6, 0.25)
* **Recurrence 2 (orange):** Relatively flat at 0.
* (2, 0.00)
* (3, 0.00)
* (4, 0.00)
* (5, 0.00)
* (6, 0.00)
* **Recurrence 4 (green):** Relatively flat, close to 0.
* (2, 0.10)
* (3, 0.00)
* (4, 0.02)
* (5, 0.06)
* (6, 0.02)
* **Recurrence 8 (red):** Starts high, drops significantly, then remains low.
* (2, 0.70)
* (3, 0.06)
* (4, 0.02)
* (5, 0.06)
* (6, 0.02)
* **Recurrence 16 (purple):** Decreases, then increases, then decreases.
* (2, 0.90)
* (3, 0.50)
* (4, 0.15)
* (5, 0.50)
* (6, 0.15)
* **Recurrence 24 (brown):** Decreases, then increases, then decreases.
* (2, 0.90)
* (3, 0.55)
* (4, 0.10)
* (5, 0.52)
* (6, 0.12)
* **Recurrence 32 (pink):** Decreases, then increases, then decreases.
* (2, 0.95)
* (3, 0.38)
* (4, 0.18)
* (5, 0.58)
* (6, 0.15)
* **Recurrence 48 (gray):** Decreases, then increases, then decreases.
* (2, 0.88)
* (3, 0.52)
* (4, 0.12)
* (5, 0.40)
* (6, 0.20)
* **Recurrence 64 (yellow):** Decreases, then increases, then decreases.
* (2, 1.00)
* (3, 0.52)
* (4, 0.18)
* (5, 0.46)
* (6, 0.10)
### Key Observations
* Recurrence levels 2, 4, and 8 consistently show low accuracy across all numbers of operands.
* Recurrence levels 16, 24, 32, 48, and 64 show a similar trend: high accuracy at 2 operands, a significant drop at 3 and 4 operands, a peak at 5 operands, and a drop again at 6 operands.
* The accuracy for most recurrence levels is highest when the number of operands is 2.
* The accuracy tends to dip when the number of operands is 4.
### Interpretation
The chart suggests that the model's accuracy is significantly affected by the recurrence level and the number of operands. Lower recurrence levels (2, 4, 8) generally perform poorly, indicating that these levels might not be sufficient for the model to learn effectively. Higher recurrence levels (16, 24, 32, 48, 64) show a more complex relationship with the number of operands, suggesting that there might be an optimal number of operands for these levels to achieve the best accuracy. The dip in accuracy at 4 operands for higher recurrence levels could indicate a point where the model struggles to generalize or encounters some form of interference. The overall trend indicates that the model performs best with a smaller number of operands (2) and that increasing the number of operands does not necessarily lead to improved accuracy.