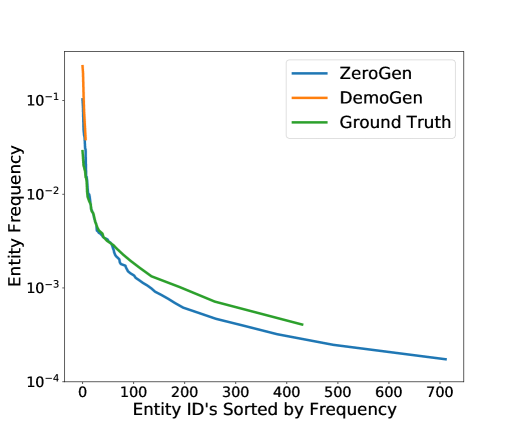
# Technical Document Extraction: Entity Frequency Analysis Chart
## Chart Type
Line chart comparing entity frequency distributions across three models.
## Axes
- **X-Axis (Horizontal):**
- Label: "Entity ID's Sorted by Frequency"
- Range: 0 to 700 (linear scale)
- Tick Marks: 0, 100, 200, 300, 400, 500, 600, 700
- **Y-Axis (Vertical):**
- Label: "Entity Frequency"
- Scale: Logarithmic (base 10)
- Range: 10⁻⁴ to 10⁻¹
- Tick Marks: 10⁻⁴, 10⁻³, 10⁻², 10⁻¹
## Legend
- **ZeroGen** (Blue line)
- **DemoGen** (Orange line)
- **Ground Truth** (Green line)
## Key Trends and Data Points
1. **Initial Sharp Decline (Entity IDs 0–100):**
- All models exhibit a steep drop in frequency.
- **DemoGen** (orange) starts highest (~10⁻¹) and drops most sharply.
- **Ground Truth** (green) begins slightly below DemoGen (~10⁻¹.⁵) and declines moderately.
- **ZeroGen** (blue) starts lowest (~10⁻¹.²) and follows a similar trajectory.
2. **Mid-Range Behavior (Entity IDs 100–400):**
- **DemoGen** flattens near 10⁻³ after the initial drop.
- **Ground Truth** maintains a steady decline, ending near 10⁻³.
- **ZeroGen** continues a gradual decline, ending near 10⁻³.⁵.
3. **Long-Tail Distribution (Entity IDs 400–700):**
- All models show a near-linear decline on the log scale.
- **ZeroGen** remains consistently the lowest-performing model across all Entity IDs.
- **DemoGen** and **Ground Truth** converge slightly but remain distinct.
## Observations
- **Logarithmic Scale Impact:** The y-axis compression emphasizes differences in high-frequency entities (IDs 0–100) while flattening the long-tail distribution.
- **Model Performance:**
- **DemoGen** approximates **Ground Truth** closely in the initial high-frequency range but diverges in the long tail.
- **ZeroGen** underperforms both models consistently, suggesting limitations in capturing high-frequency entities.
- **Entity Sorting:** The x-axis reflects a frequency-based ranking, implying Entity ID 0 is the most frequent, and ID 700 the least.
## Cross-Referenced Legend Accuracy
- Blue line (ZeroGen) matches legend label.
- Orange line (DemoGen) matches legend label.
- Green line (Ground Truth) matches legend label.
## Conclusion
The chart highlights trade-offs between model performance in high-frequency vs. long-tail entity distributions. **DemoGen** balances proximity to **Ground Truth** in critical ranges, while **ZeroGen** lags across the spectrum.