\n
## Line Chart: ΔP vs. Layer for Llama-3 Models
### Overview
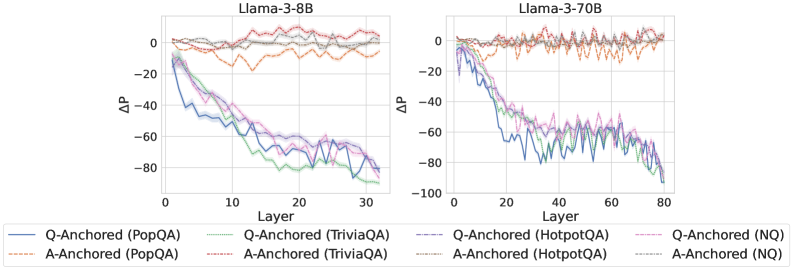
The image presents two line charts, side-by-side, comparing the change in probability (ΔP) across layers for two Llama-3 models: Llama-3-8B and Llama-3-70B. The charts display ΔP as a function of layer number, with different lines representing different anchoring strategies and question-answering datasets.
### Components/Axes
* **X-axis:** Layer (ranging from 0 to approximately 30 for the 8B model and 0 to 80 for the 70B model).
* **Y-axis:** ΔP (ranging from approximately -100 to 0).
* **Models:** Llama-3-8B (left chart), Llama-3-70B (right chart).
* **Legend:**
* Q-Anchored (PopQA) - Blue line
* A-Anchored (PopQA) - Orange dashed line
* Q-Anchored (TriviaQA) - Green line
* A-Anchored (TriviaQA) - Purple dashed line
* Q-Anchored (HotpotQA) - Light-blue line
* A-Anchored (HotpotQA) - Red dashed line
* Q-Anchored (NQ) - Teal line
* A-Anchored (NQ) - Brown dashed line
### Detailed Analysis or Content Details
**Llama-3-8B (Left Chart):**
* **Q-Anchored (PopQA) - Blue Line:** Starts at approximately -10, rapidly decreases to approximately -70 by layer 5, then plateaus around -70 to -80 from layer 10 onwards.
* **A-Anchored (PopQA) - Orange Dashed Line:** Remains relatively stable around 0 to -10 across all layers.
* **Q-Anchored (TriviaQA) - Green Line:** Starts at approximately -5, decreases to approximately -60 by layer 5, and then continues to decrease, reaching approximately -85 by layer 30.
* **A-Anchored (TriviaQA) - Purple Dashed Line:** Starts at approximately -10, decreases to approximately -50 by layer 5, and then plateaus around -50 to -60.
* **Q-Anchored (HotpotQA) - Light-blue Line:** Starts at approximately -10, decreases to approximately -60 by layer 5, and then continues to decrease, reaching approximately -80 by layer 30.
* **A-Anchored (HotpotQA) - Red Dashed Line:** Remains relatively stable around 0 to -10 across all layers.
* **Q-Anchored (NQ) - Teal Line:** Starts at approximately -10, decreases to approximately -60 by layer 5, and then continues to decrease, reaching approximately -80 by layer 30.
* **A-Anchored (NQ) - Brown Dashed Line:** Remains relatively stable around 0 to -10 across all layers.
**Llama-3-70B (Right Chart):**
* **Q-Anchored (PopQA) - Blue Line:** Starts at approximately -10, rapidly decreases to approximately -70 by layer 10, then plateaus around -70 to -80 from layer 20 onwards.
* **A-Anchored (PopQA) - Orange Dashed Line:** Remains relatively stable around 0 to -10 across all layers.
* **Q-Anchored (TriviaQA) - Green Line:** Starts at approximately -5, decreases to approximately -60 by layer 10, and then continues to decrease, reaching approximately -90 by layer 80.
* **A-Anchored (TriviaQA) - Purple Dashed Line:** Starts at approximately -10, decreases to approximately -50 by layer 10, and then plateaus around -50 to -60.
* **Q-Anchored (HotpotQA) - Light-blue Line:** Starts at approximately -10, decreases to approximately -60 by layer 10, and then continues to decrease, reaching approximately -80 by layer 80.
* **A-Anchored (HotpotQA) - Red Dashed Line:** Remains relatively stable around 0 to -10 across all layers.
* **Q-Anchored (NQ) - Teal Line:** Starts at approximately -10, decreases to approximately -60 by layer 10, and then continues to decrease, reaching approximately -80 by layer 80.
* **A-Anchored (NQ) - Brown Dashed Line:** Remains relatively stable around 0 to -10 across all layers.
### Key Observations
* For both models, the Q-Anchored lines (PopQA, TriviaQA, HotpotQA, NQ) exhibit a similar trend: a steep initial decrease in ΔP followed by a plateau.
* The A-Anchored lines (PopQA, TriviaQA, HotpotQA, NQ) remain relatively stable around 0 to -10, indicating minimal change in probability.
* The 70B model shows a more extended plateau phase compared to the 8B model.
* TriviaQA consistently shows a lower ΔP value than other datasets for Q-Anchored lines.
### Interpretation
The charts demonstrate how the change in probability (ΔP) varies across layers for different question-answering datasets and anchoring strategies in Llama-3 models. The significant decrease in ΔP for Q-Anchored lines suggests that the model's confidence in its predictions changes substantially as information propagates through the layers. The plateau indicates that the model reaches a point where further processing doesn't significantly alter its predictions.
The stability of A-Anchored lines suggests that anchoring on the answer side doesn't lead to substantial changes in probability across layers. This could imply that the model's initial understanding of the question is more influential than refining the answer during processing.
The differences between datasets (e.g., TriviaQA consistently showing lower ΔP) suggest that the model's behavior is sensitive to the characteristics of the training data. The larger model (70B) exhibits a more prolonged plateau, potentially indicating a greater capacity to process information and maintain stable predictions across deeper layers.
The consistent negative ΔP values for Q-Anchored lines suggest that the model is becoming more confident in its predictions as it processes the input, which is expected. The magnitude of the decrease and the plateau level provide insights into the model's learning dynamics and its ability to generalize across different datasets.