## Line Chart: ΔP Performance Across Layers for LLaMA-3-8B and LLaMA-3-70B Models
### Overview
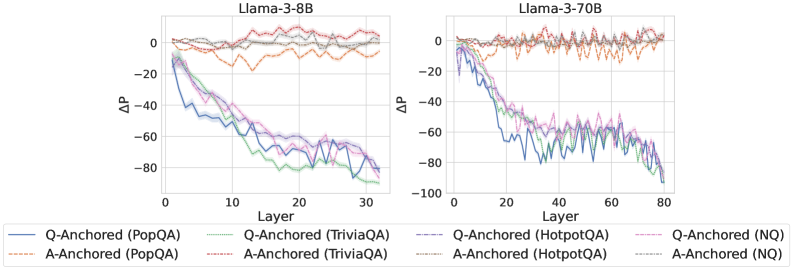
The image contains two side-by-side line charts comparing the ΔP (performance change) of different model configurations (Q-Anchored and A-Anchored) across layers for two LLaMA-3 model sizes: 8B and 70B. Each chart includes multiple data series representing different question-answering datasets (PopQA, TriviaQA, HotpotQA, NQ). The charts show how ΔP values evolve across model layers, with distinct trends for each configuration and dataset.
### Components/Axes
- **X-Axis (Layer)**:
- Left panel (LLaMA-3-8B): Layers 0–30
- Right panel (LLaMA-3-70B): Layers 0–80
- Discrete integer values with no intermediate markers
- **Y-Axis (ΔP)**:
- Range: -100 to 0 (negative values indicate performance degradation)
- Tick intervals: -100, -80, -60, -40, -20, 0
- **Legend**:
- Located at the bottom of both panels
- Line styles and colors:
- **Solid lines**: Q-Anchored configurations
- **Dashed lines**: A-Anchored configurations
- **Color coding**:
- Blue: PopQA
- Green: TriviaQA
- Purple: HotpotQA
- Red: NQ
- Labels:
- Q-Anchored (PopQA)
- Q-Anchored (TriviaQA)
- Q-Anchored (HotpotQA)
- Q-Anchored (NQ)
- A-Anchored (PopQA)
- A-Anchored (TriviaQA)
- A-Anchored (HotpotQA)
- A-Anchored (NQ)
### Detailed Analysis
#### LLaMA-3-8B Panel (Left)
- **Q-Anchored (PopQA)**:
- Starts near 0 at Layer 0, sharply declines to ~-80 by Layer 10, then fluctuates between -60 and -40 until Layer 30.
- **A-Anchored (PopQA)**:
- Begins at ~-10, rises to ~0 by Layer 5, then stabilizes near 0 with minor oscillations.
- **Q-Anchored (TriviaQA)**:
- Drops from 0 to ~-60 by Layer 15, then stabilizes with minor fluctuations.
- **A-Anchored (TriviaQA)**:
- Remains near 0 with slight oscillations throughout.
- **Q-Anchored (HotpotQA)**:
- Declines steeply to ~-80 by Layer 10, then fluctuates between -60 and -40.
- **A-Anchored (HotpotQA)**:
- Starts at ~-10, rises to ~0 by Layer 5, then stabilizes.
- **Q-Anchored (NQ)**:
- Sharp decline to ~-80 by Layer 10, then stabilizes with minor oscillations.
- **A-Anchored (NQ)**:
- Begins at ~-10, rises to ~0 by Layer 5, then stabilizes.
#### LLaMA-3-70B Panel (Right)
- **Q-Anchored (PopQA)**:
- Starts near 0, dips to ~-80 by Layer 20, then fluctuates between -60 and -40.
- **A-Anchored (PopQA)**:
- Begins at ~-10, rises to ~0 by Layer 10, then stabilizes with minor oscillations.
- **Q-Anchored (TriviaQA)**:
- Declines to ~-60 by Layer 30, then stabilizes with fluctuations.
- **A-Anchored (TriviaQA)**:
- Remains near 0 with slight oscillations.
- **Q-Anchored (HotpotQA)**:
- Drops to ~-80 by Layer 20, then fluctuates between -60 and -40.
- **A-Anchored (HotpotQA)**:
- Starts at ~-10, rises to ~0 by Layer 10, then stabilizes.
- **Q-Anchored (NQ)**:
- Sharp decline to ~-100 by Layer 20, then stabilizes with oscillations.
- **A-Anchored (NQ)**:
- Begins at ~-10, rises to ~0 by Layer 10, then stabilizes.
### Key Observations
1. **Model Size Impact**:
- The 70B model shows more pronounced fluctuations in ΔP values compared to the 8B model, particularly in the middle layers (e.g., Layers 20–40).
2. **Anchoring Strategy**:
- A-Anchored configurations generally maintain higher ΔP values (closer to 0) than Q-Anchored configurations across most datasets.
3. **Dataset Variability**:
- NQ (Natural Questions) shows the most severe performance degradation for Q-Anchored models, reaching ~-100 in the 70B model.
4. **Layer-Specific Trends**:
- Performance degradation for Q-Anchored models often occurs in the middle layers (e.g., Layers 10–30 for 8B, Layers 20–40 for 70B).
5. **Stability**:
- A-Anchored models exhibit greater stability, with ΔP values clustering near 0 after initial adjustments.
### Interpretation
The charts suggest that anchoring strategies (Q-Anchored vs. A-Anchored) significantly influence model performance across layers. A-Anchored configurations appear more robust, maintaining closer-to-zero ΔP values, while Q-Anchored models experience sharper declines, particularly in complex datasets like NQ. The 70B model’s increased layer count correlates with more variability in ΔP, indicating potential challenges in scaling. These trends highlight the importance of anchoring strategies in mitigating performance degradation in large language models.