## Diagram: Grid Network with Symbolic Markers
### Overview
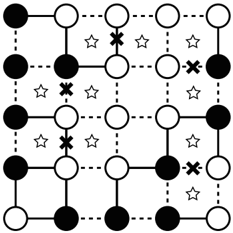
The image depicts a 4x4 grid of interconnected nodes (circles) with alternating black and white colors. Lines (solid and dashed) connect adjacent nodes, forming a network. Symbols (stars and X marks) are placed on specific nodes, suggesting annotations or markers. No textual labels, axis titles, or legends are visible.
### Components/Axes
- **Nodes**: 16 circles arranged in a 4x4 grid.
- **Color Pattern**: Alternating black and white (e.g., black at (1,1), white at (1,2), etc.).
- **Positioning**: Nodes are evenly spaced with dashed lines connecting adjacent nodes (horizontal, vertical, and diagonal).
- **Lines**:
- Solid lines connect nodes in the same row/column.
- Dashed lines connect diagonal nodes.
- **Symbols**:
- **Stars**: Placed on 4 nodes (e.g., (1,3), (2,2), (3,4), (4,1)).
- **X Marks**: Placed on 3 nodes (e.g., (2,3), (3,2), (4,3)).
- **No Textual Elements**: No axis titles, legends, or labels are present.
### Detailed Analysis
- **Node Colors**:
- Black nodes: (1,1), (1,3), (2,2), (2,4), (3,1), (3,3), (4,2), (4,4).
- White nodes: (1,2), (1,4), (2,1), (2,3), (3,2), (3,4), (4,1), (4,3).
- **Symbol Placement**:
- Stars: (1,3), (2,2), (3,4), (4,1).
- X Marks: (2,3), (3,2), (4,3).
- **Line Connections**:
- Solid lines form a grid structure (horizontal/vertical).
- Dashed lines form diagonal connections (e.g., (1,1) to (2,2), (2,2) to (3,3), etc.).
### Key Observations
1. **Symmetry**: The grid exhibits a checkerboard pattern with alternating colors.
2. **Symbol Distribution**: Stars and X marks are not uniformly distributed, suggesting a potential pattern or purpose (e.g., highlighting specific nodes).
3. **Line Types**: Solid lines dominate the grid structure, while dashed lines add diagonal connectivity.
### Interpretation
The diagram likely represents a network or system with nodes (circles) and connections (lines). The symbols (stars and X marks) may indicate:
- **Stars**: Critical nodes, hubs, or points of interest.
- **X Marks**: Nodes with errors, failures, or special status.
The absence of textual labels or legends limits direct interpretation, but the structured grid and symbolic annotations suggest a model for analyzing relationships, dependencies, or anomalies in a system. The diagonal dashed lines could imply secondary or indirect connections, while the solid lines represent primary pathways.
**Note**: No factual data, numerical values, or textual content is present in the image. The analysis is based solely on visual elements and symbolic patterns.